
25 September 2018
Breaking new ground

Overview
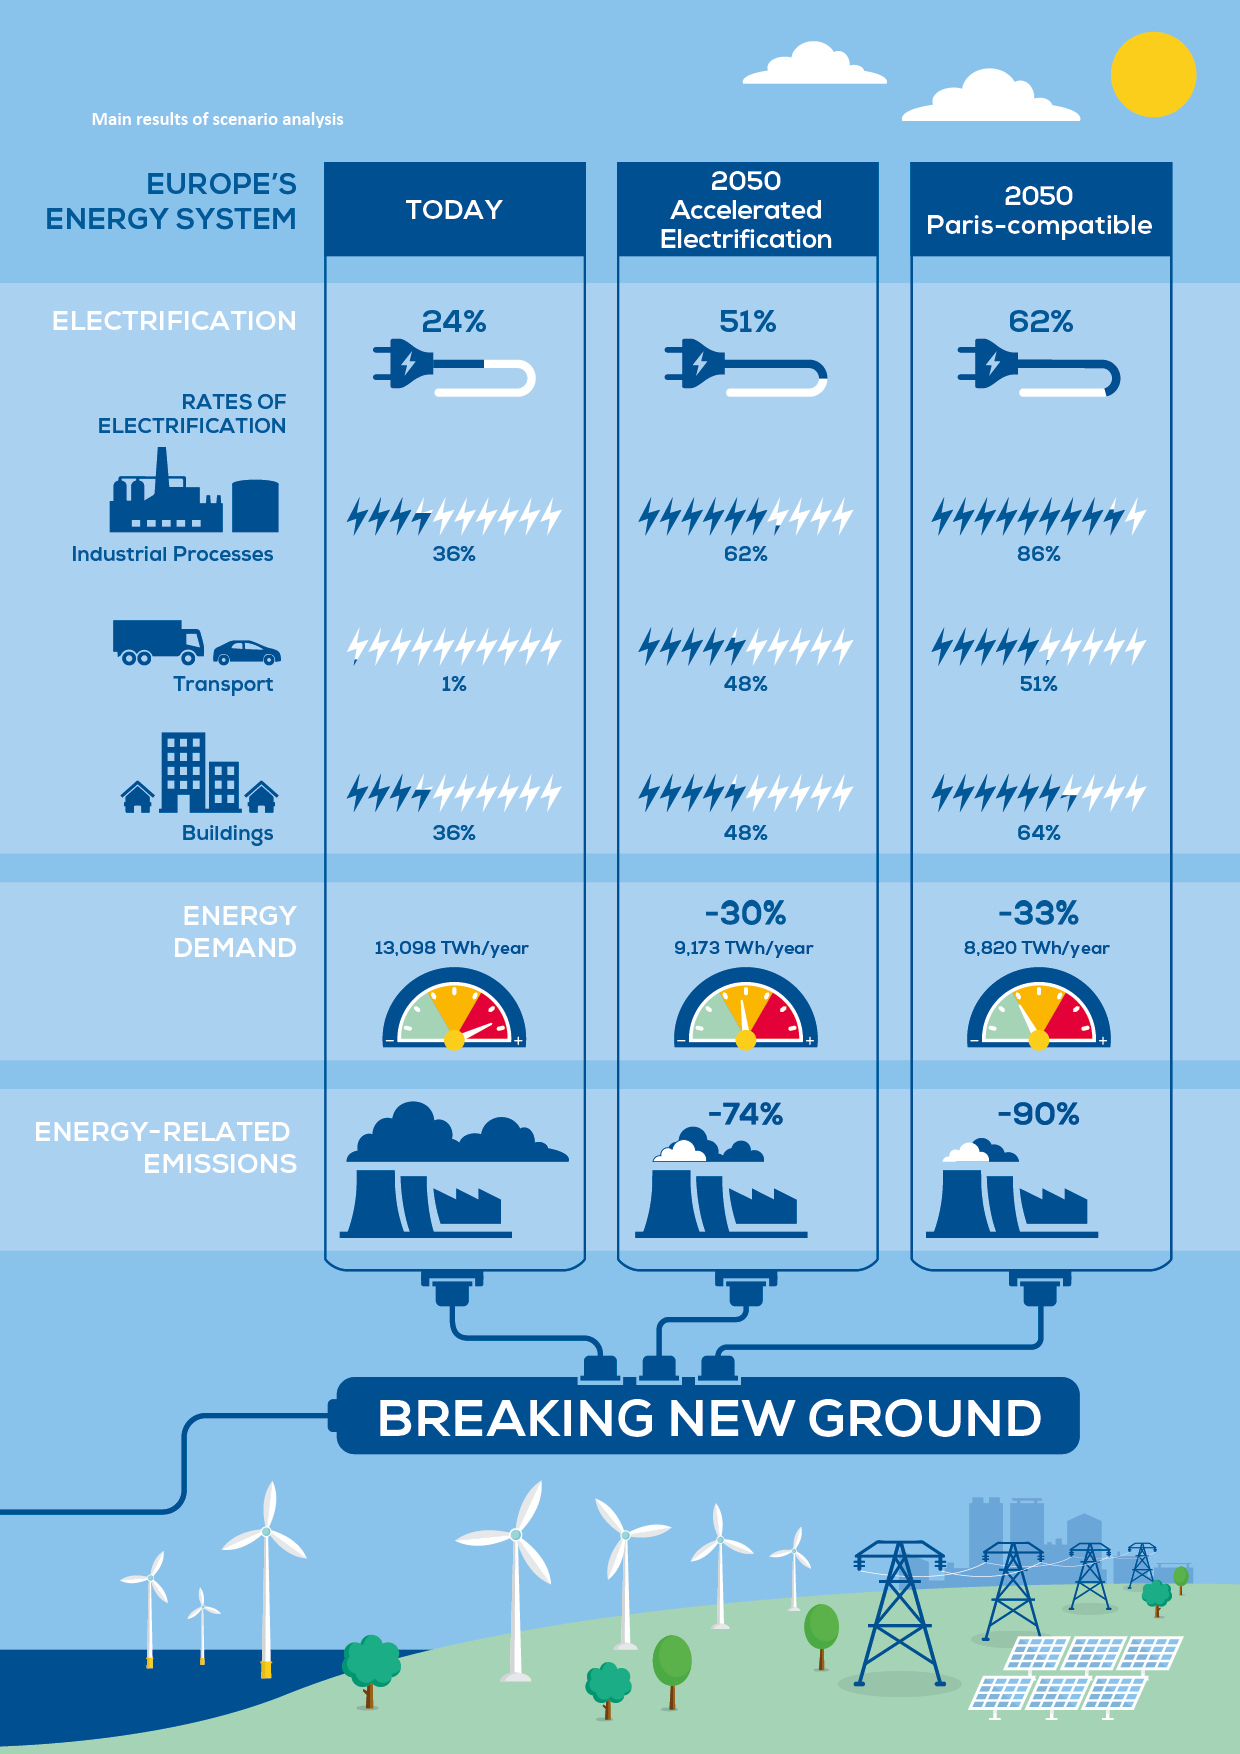
The decarbonisation of Europe’s electricity sector has been one of the most transformative changes in the economy over the last two decades. However, electricity is only about 24% of Europe’s energy consumption. And renewables account only for 30% of Europe’s electricity supply today. The vast majority of Europe’s energy remains fossil fuel-based.
Considering Europe’s remarkable potential for renewable power generation, a rapid electrification of the most carbon-intensive energy uses is the best and most efficient way to simultaneously decarbonise and grow Europe’s economy.
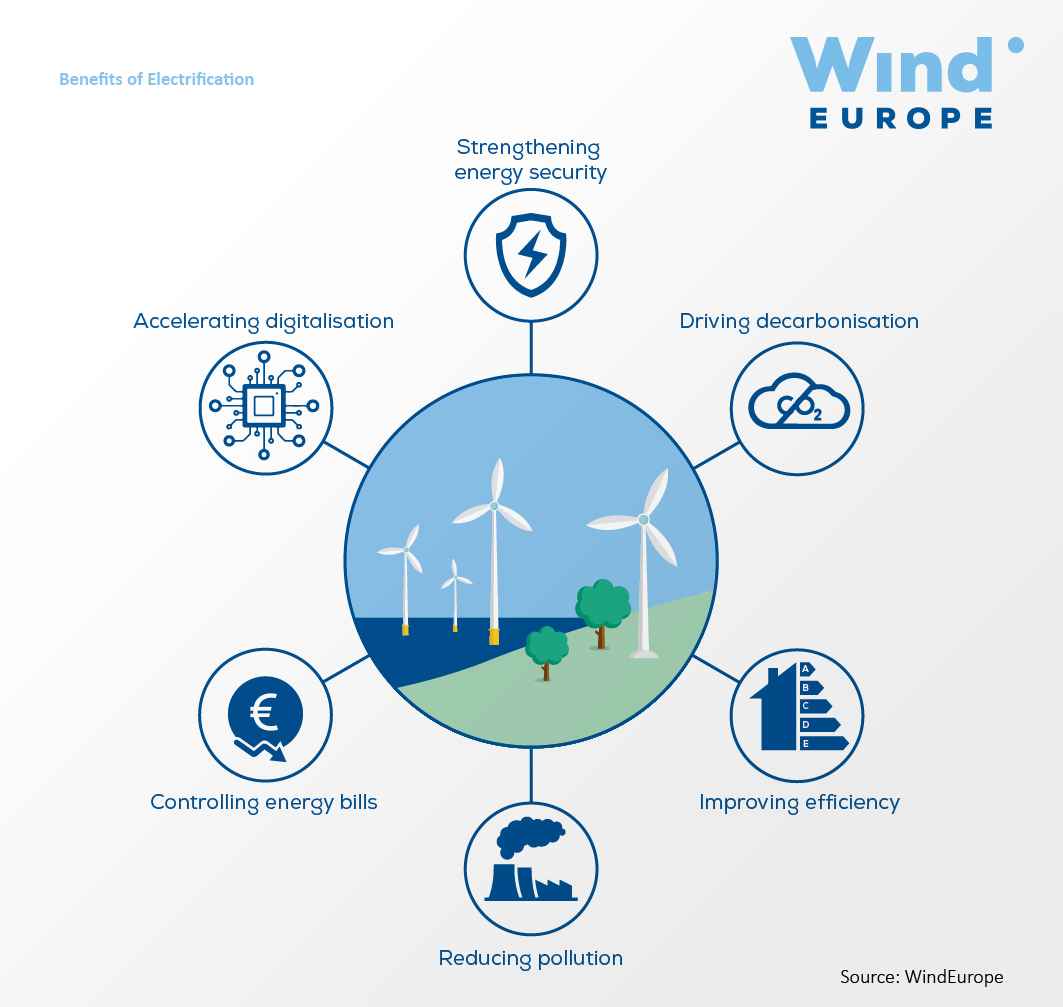
Integrating the power sector in heating, cooling and transport is the next big transformation in Europe’s economy. Coupled with advances in digitalisation, machine learning and artificial intelligence, a renewables-based energy system could become an engine of growth and technological leadership.
With this report, WindEurope puts forward two pathways for the electrification of Europe’s energy system, capitalising on the societal benefits of electrification.


Findings


Explore the key figures
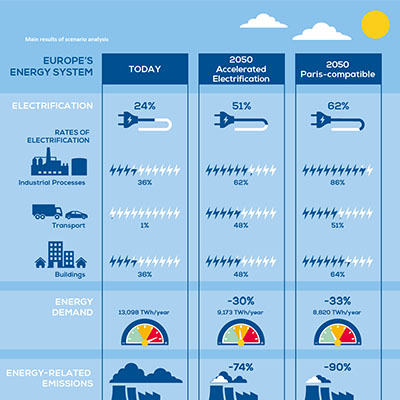
Main results of scenario analysis
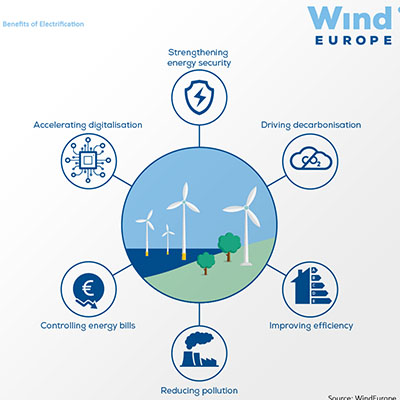
Benefits of Electrification

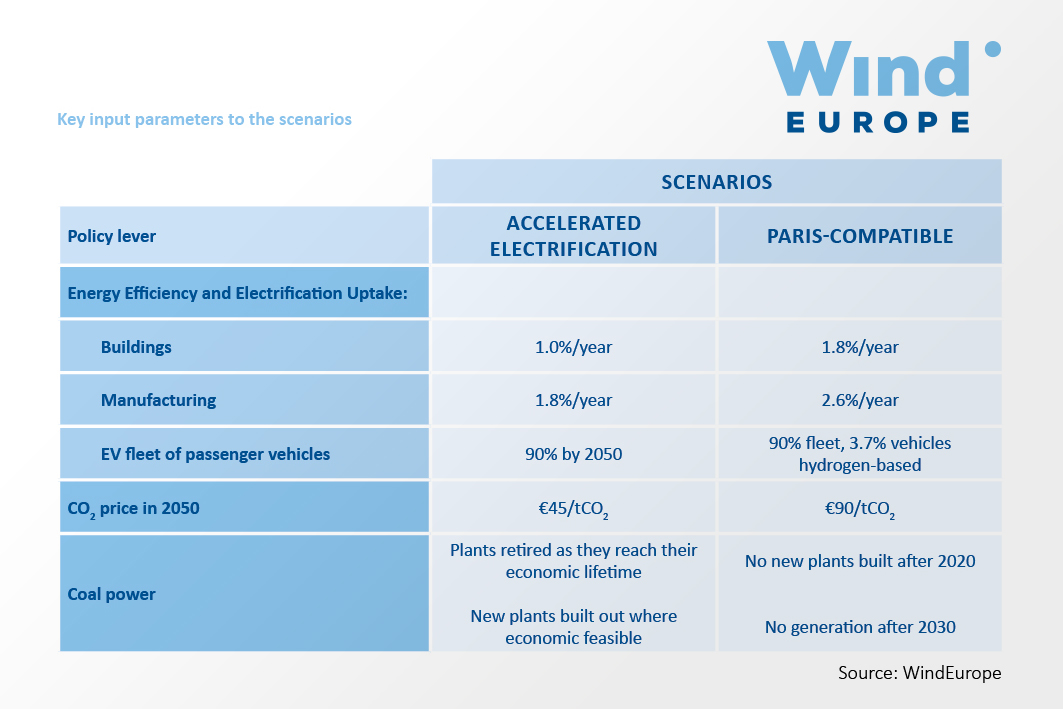
Key input parameters to the scenarios
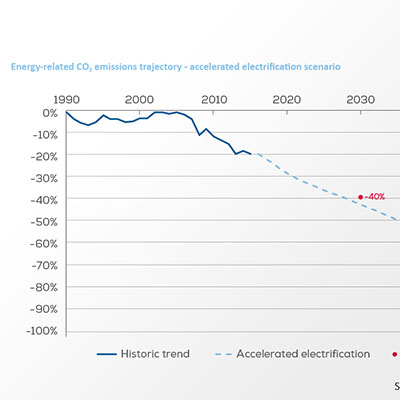
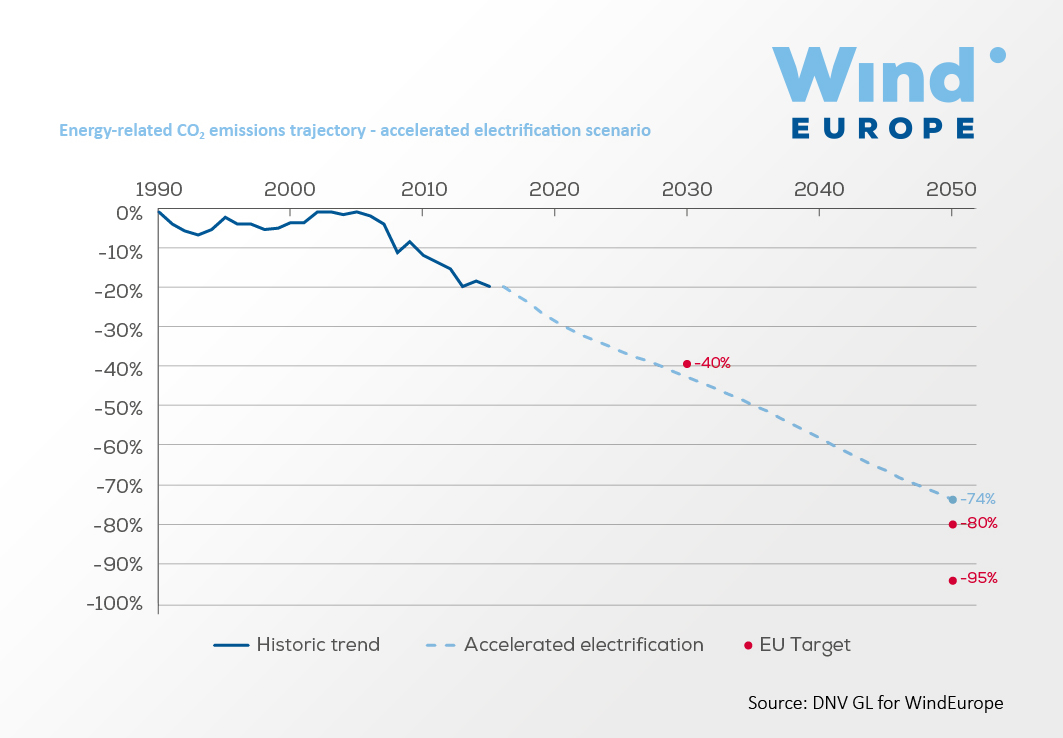
Energy-related CO2 emissions trajectory – accelerated electrification scenario
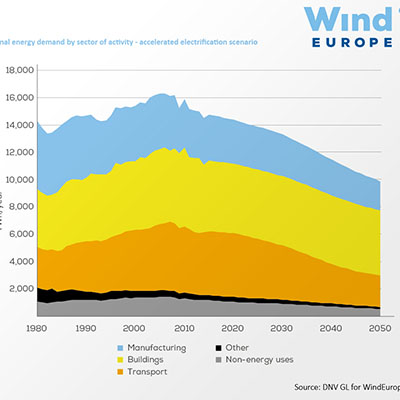
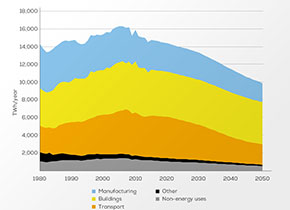
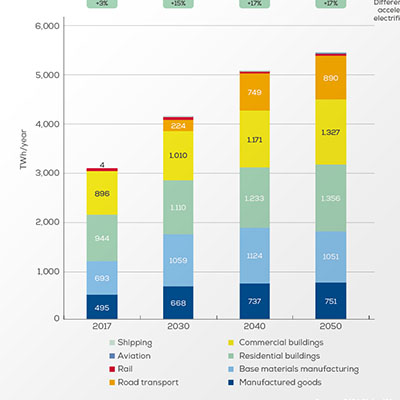
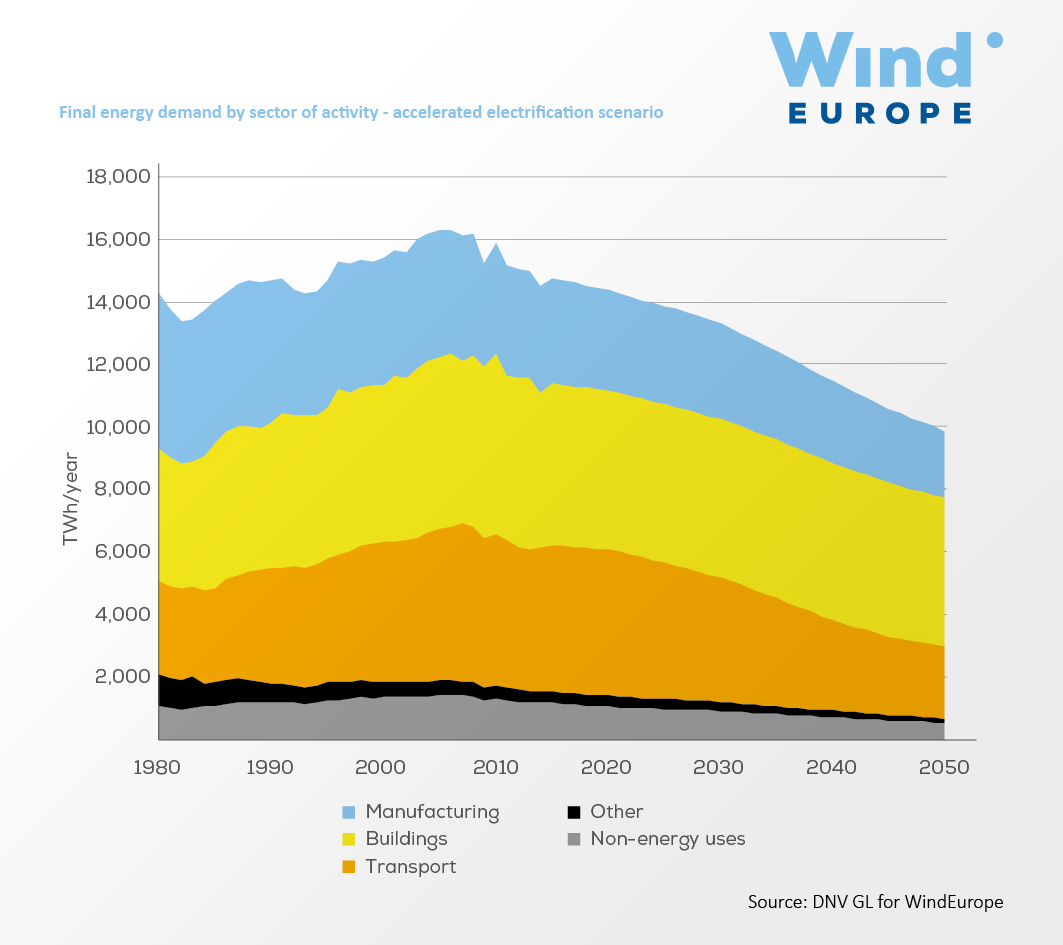
Final energy demand by sector of activity
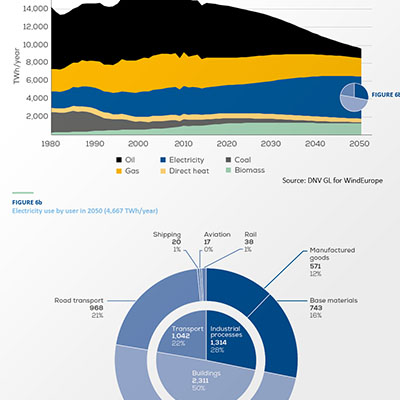
Final energy demand by fuel
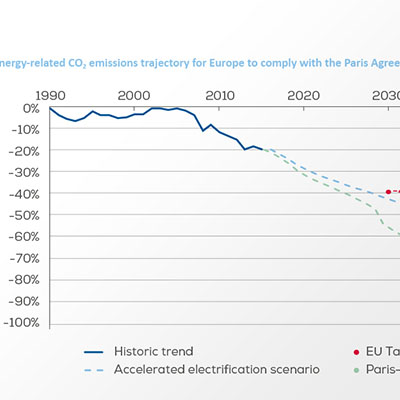
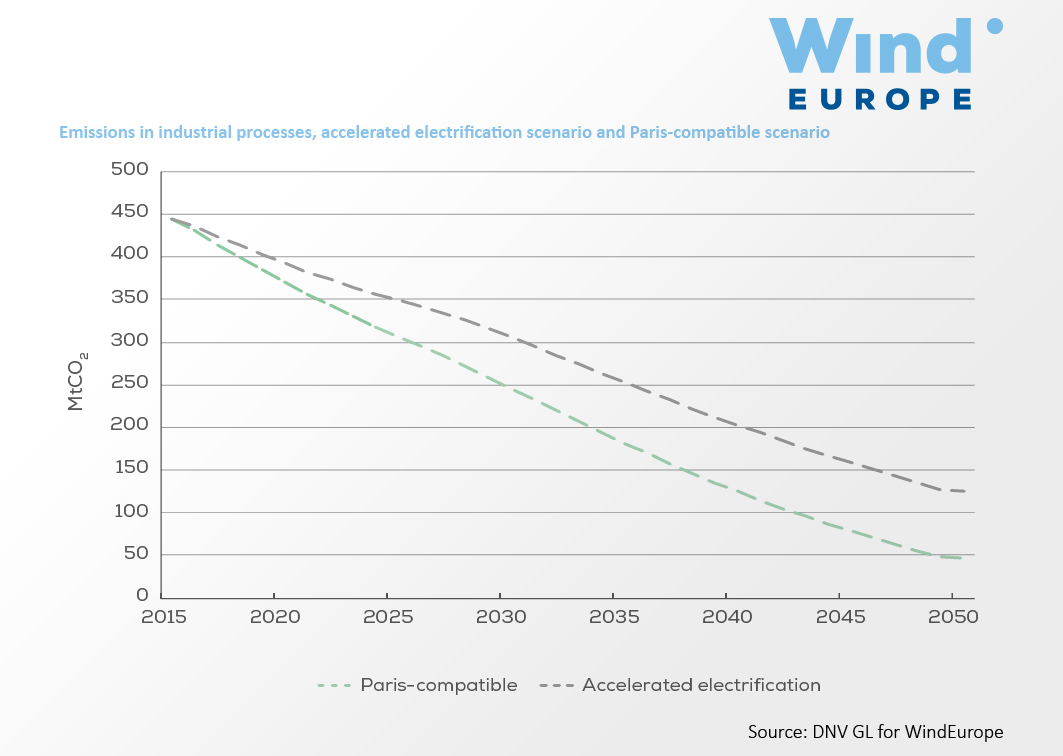
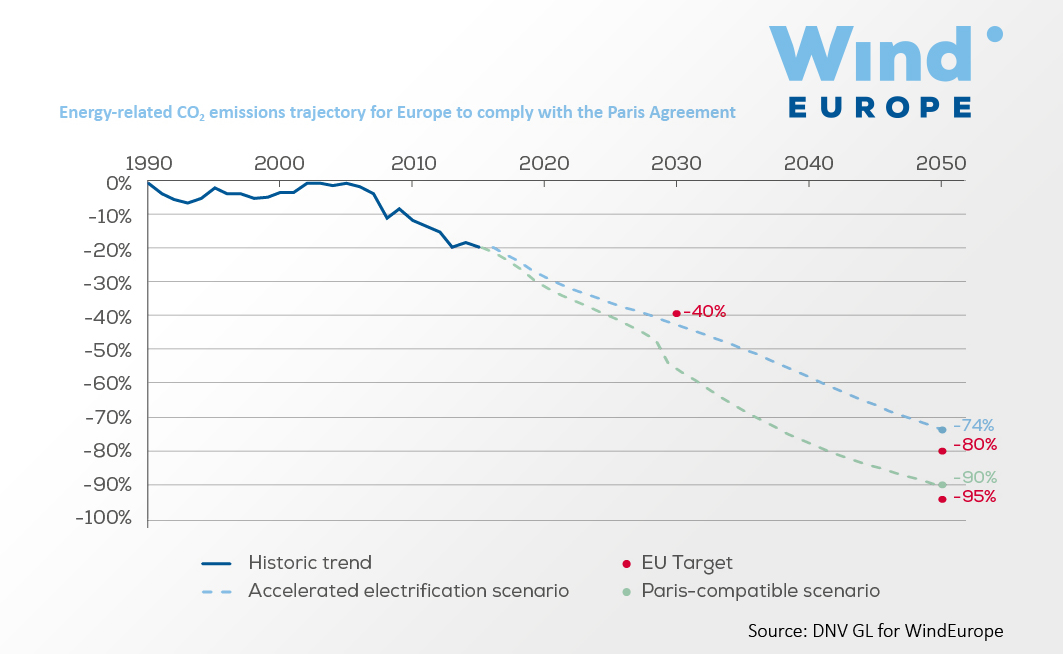
Energy-related CO2 emissions trajectory for Europe to comply with the Paris Agreement
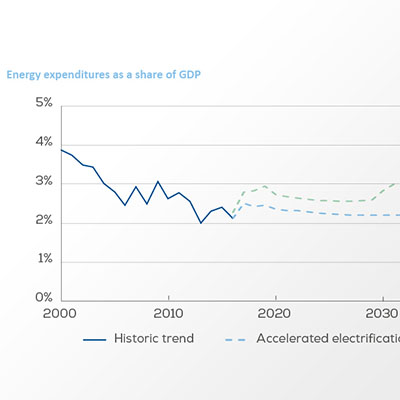
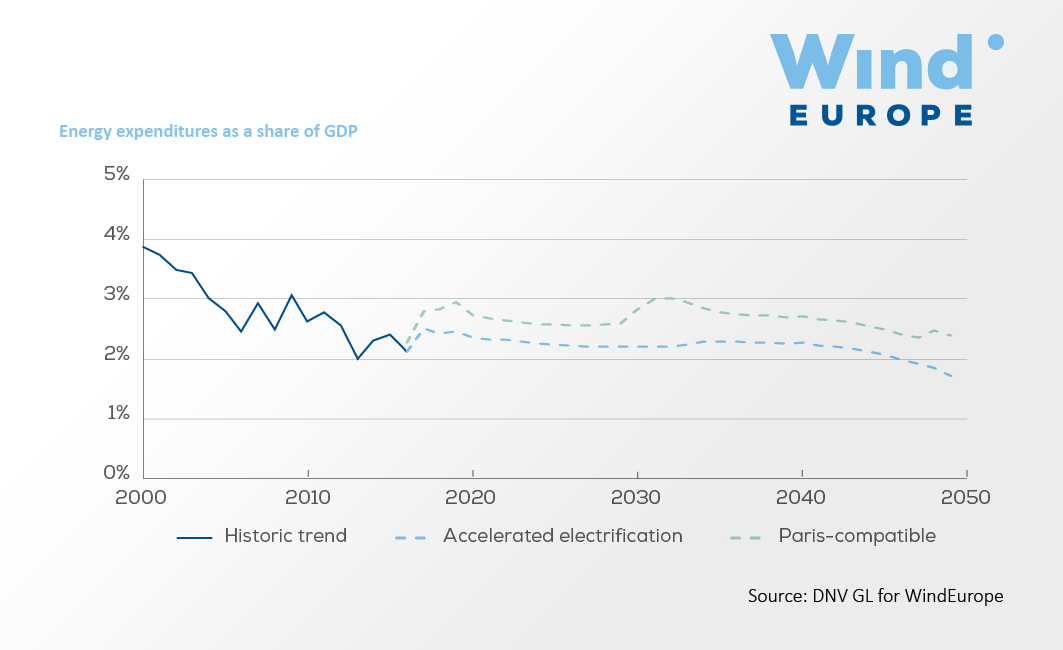
Energy expenditures as a share of GDP
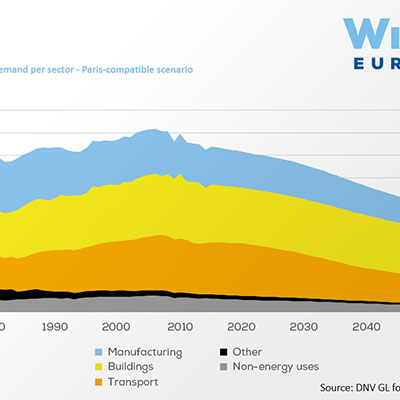
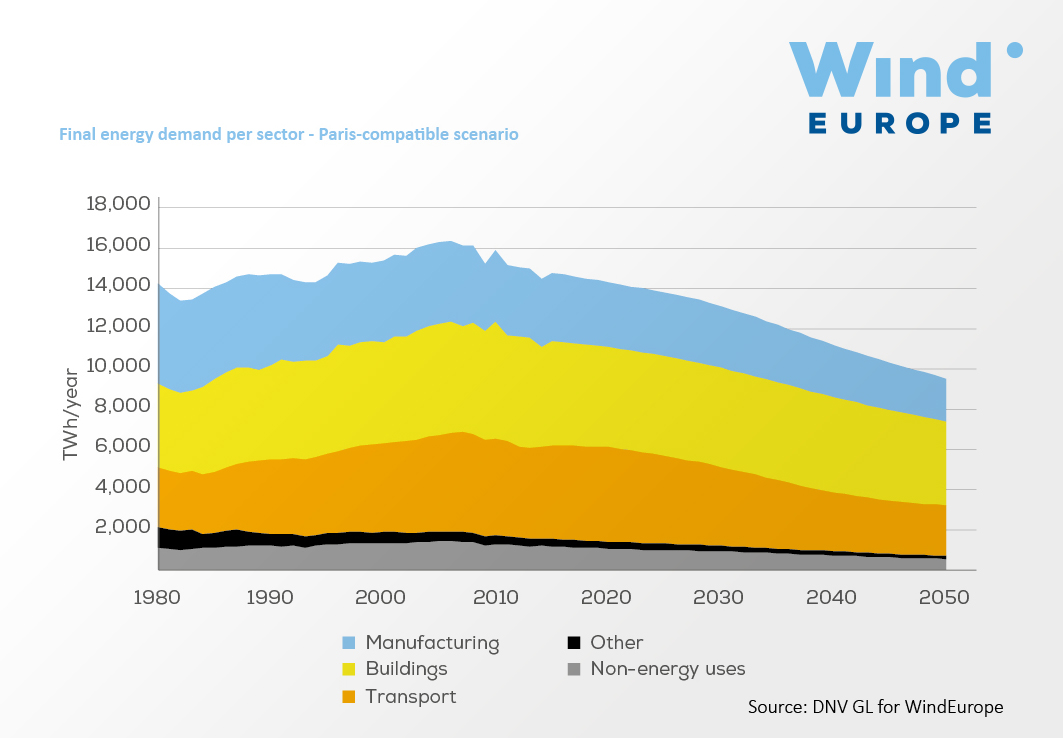
Final energy demand per sector
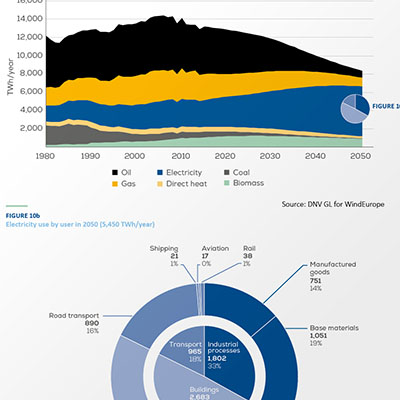
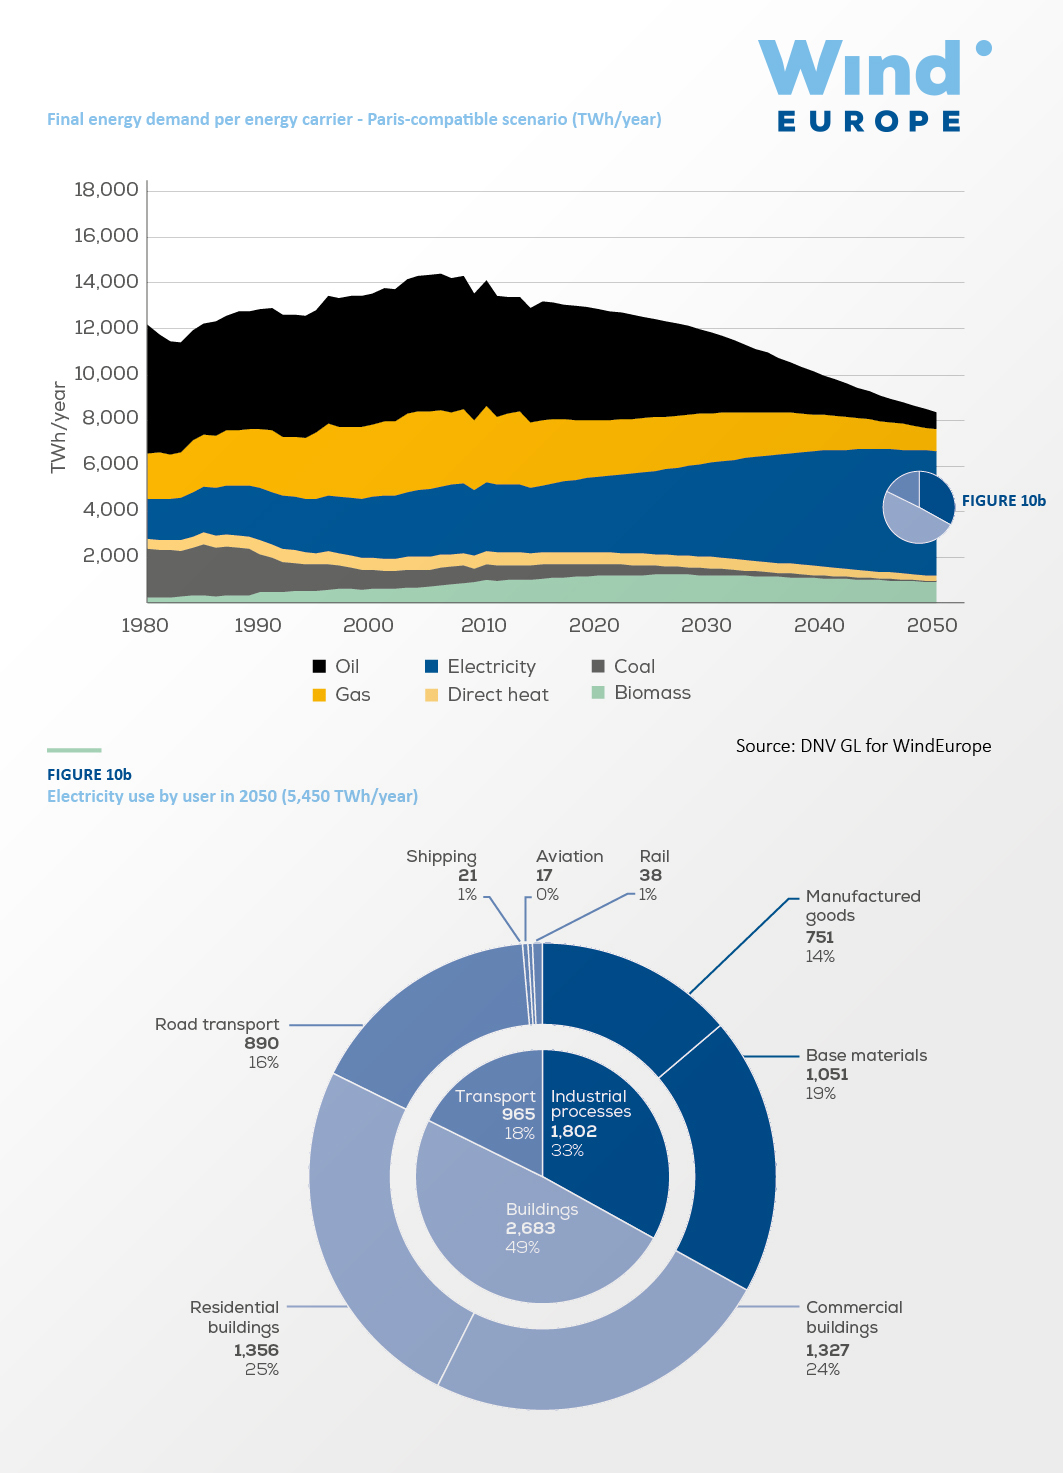
Final energy demand per energy carrier
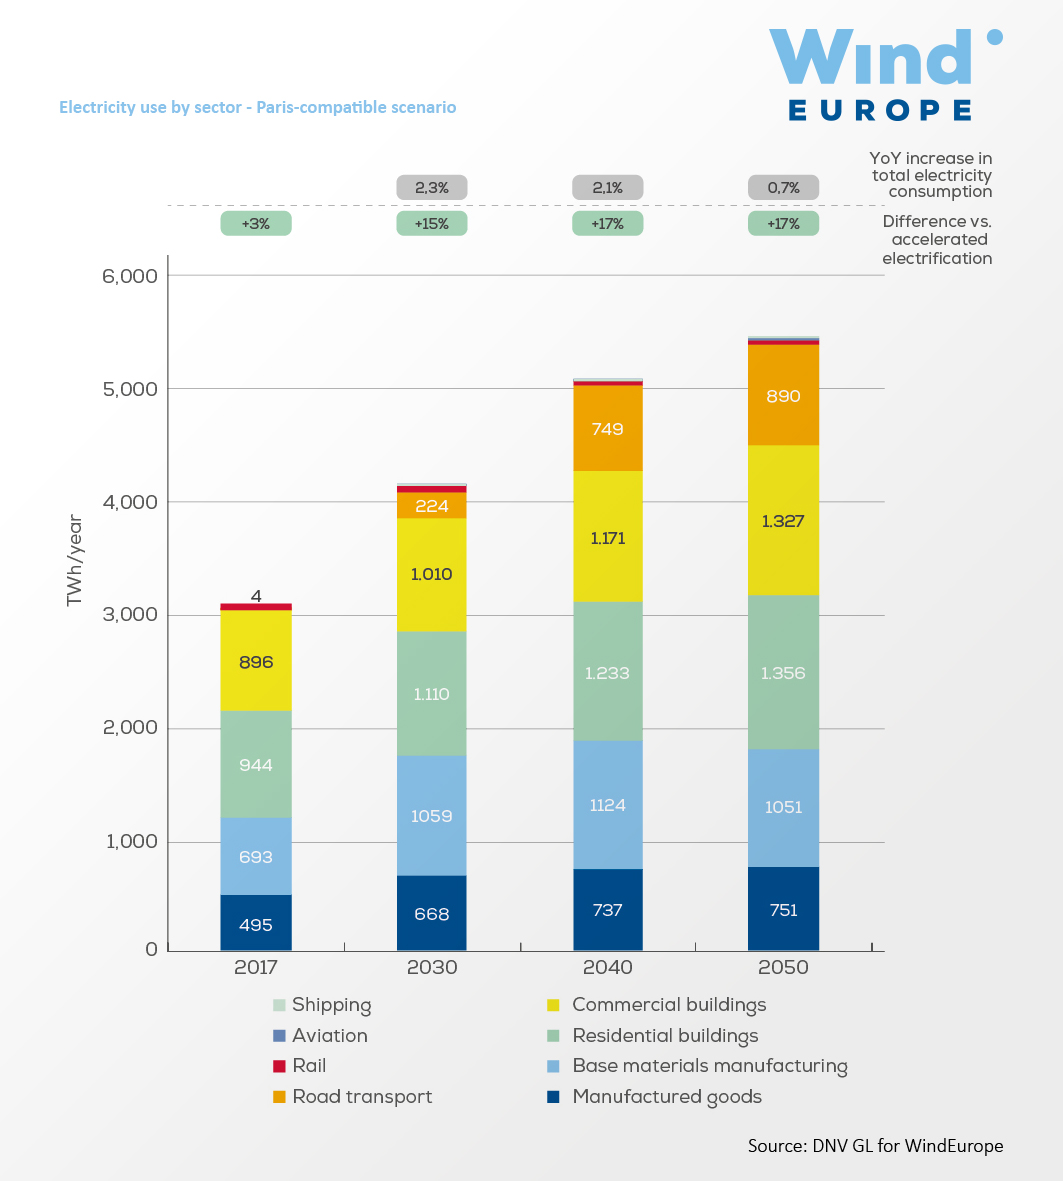
Electricity use by sector
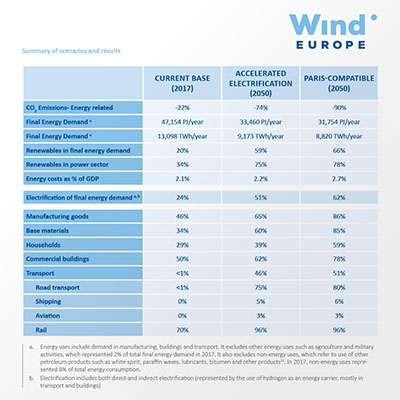
Summary of scenarios and results
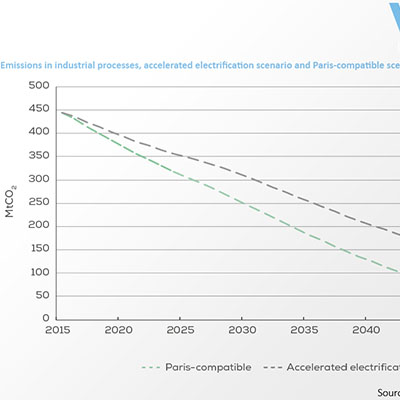
Emissions in industrial processes, accelerated electrification scenario
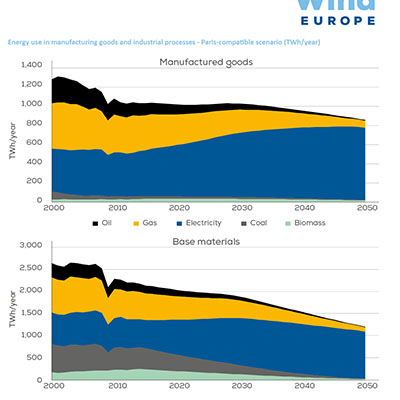
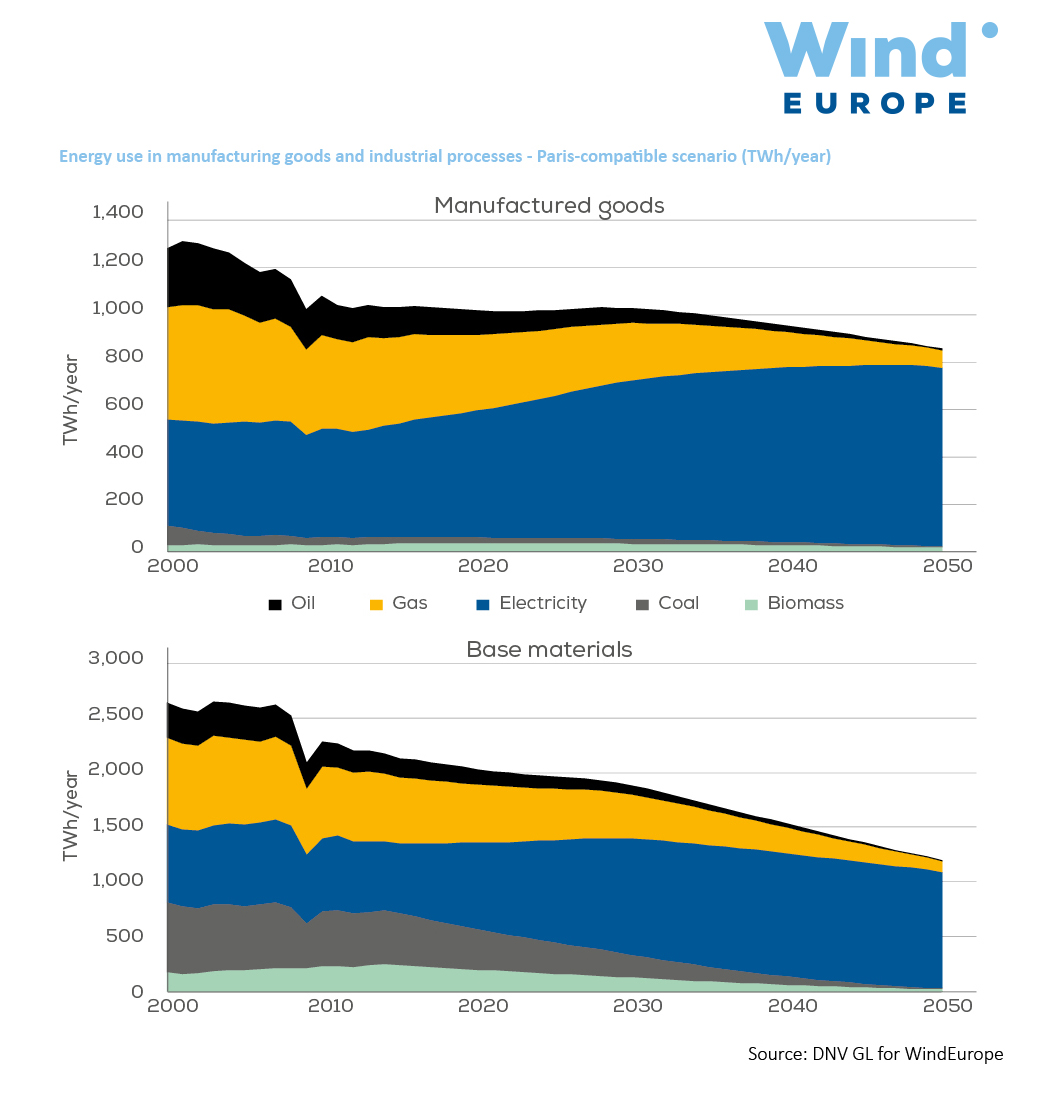
Energy use in manufacturing goods and industrial processes – Paris-compatible scenario
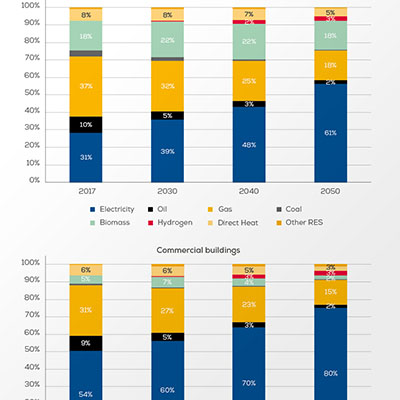
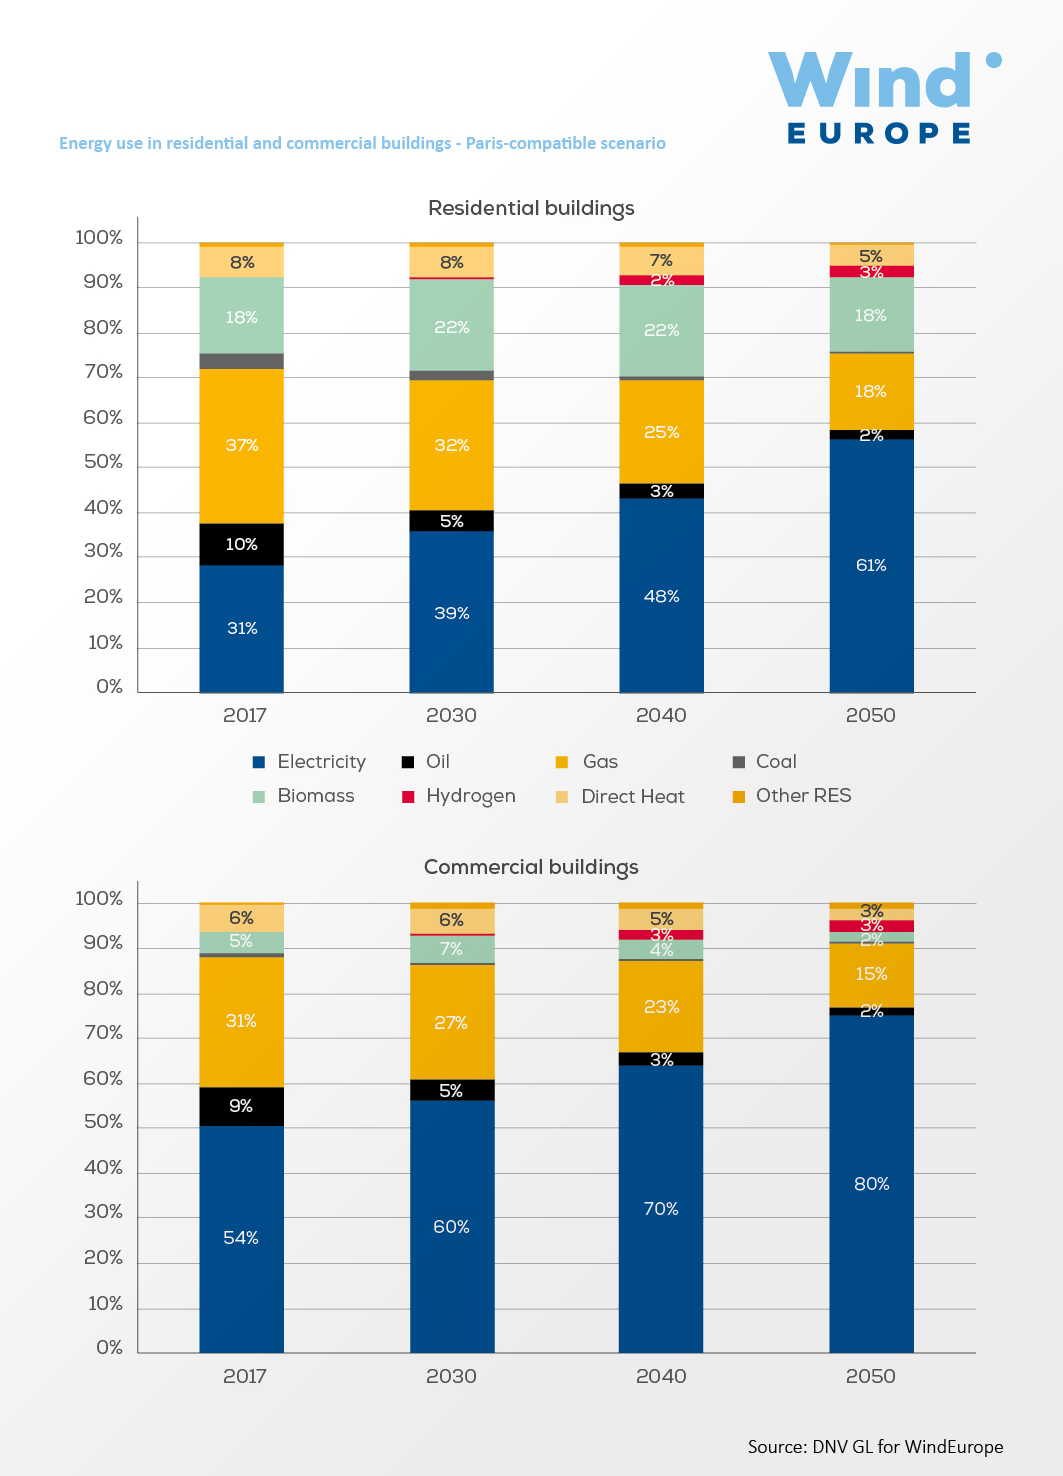
Energy use in residential and commercial buildings
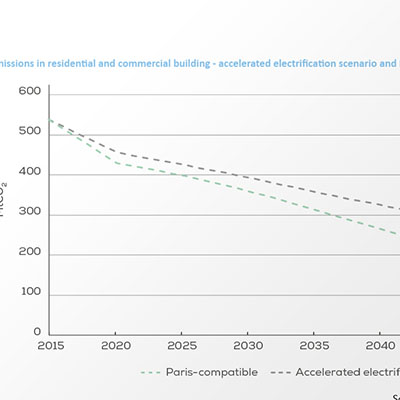
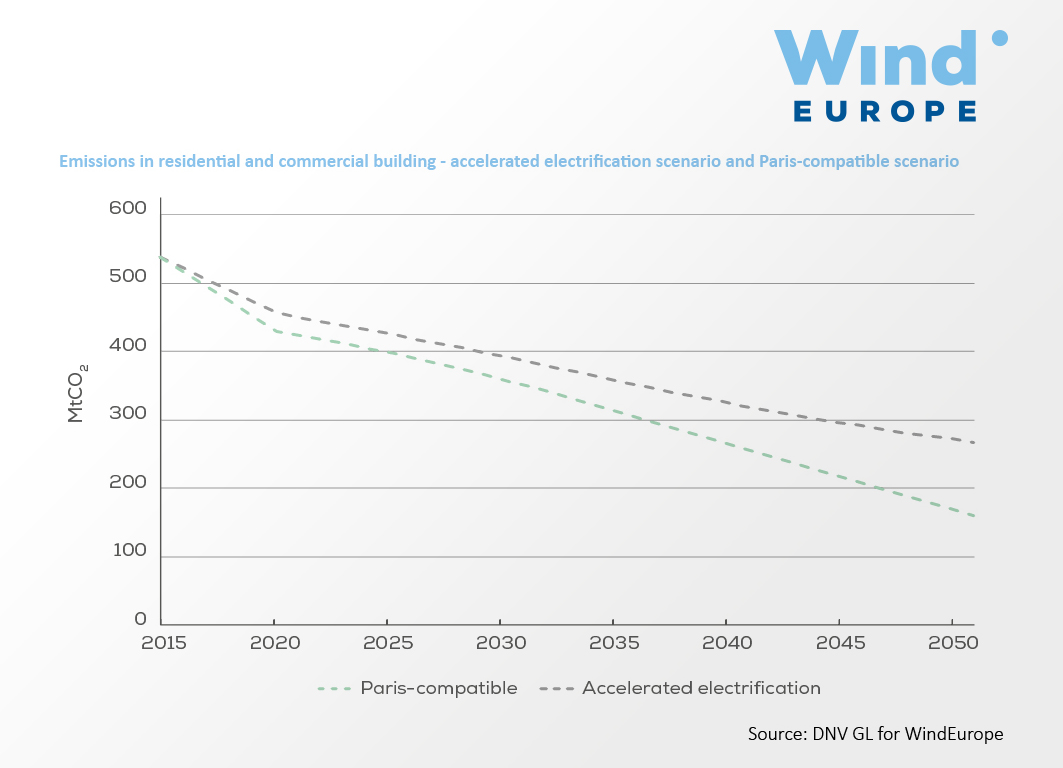
Emissions in residential and commercial building
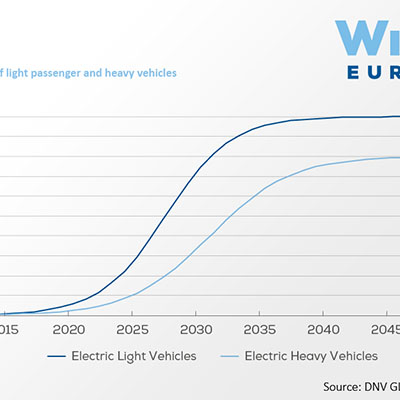
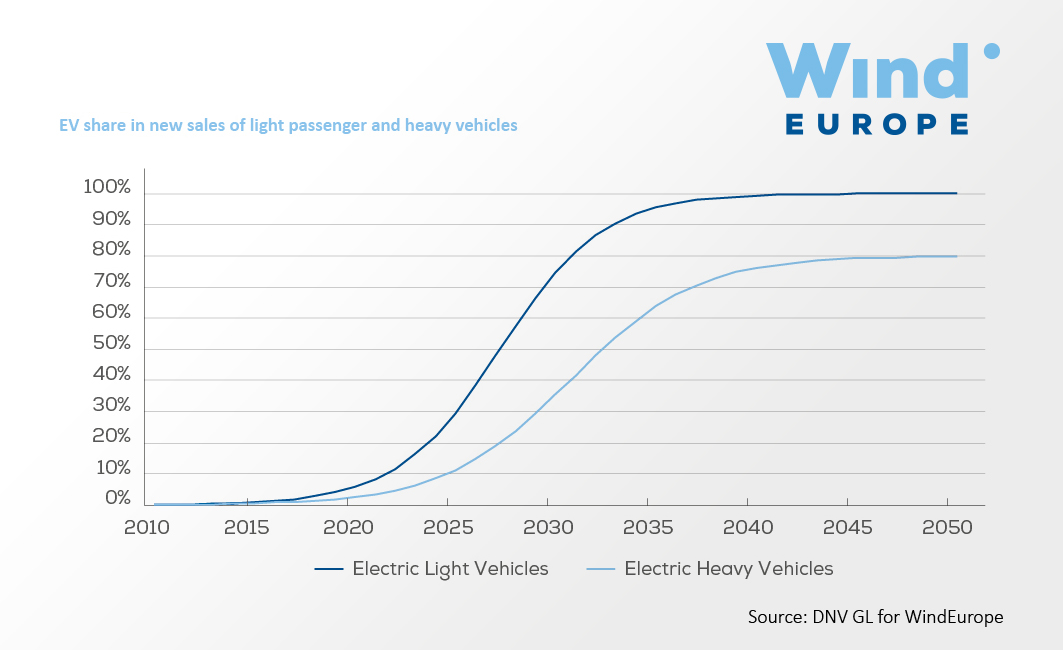
EV share in new sales of light passenger and heavy vehicles
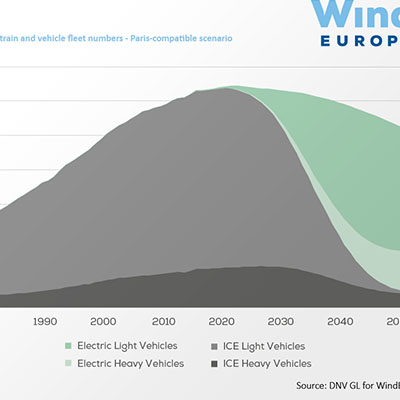
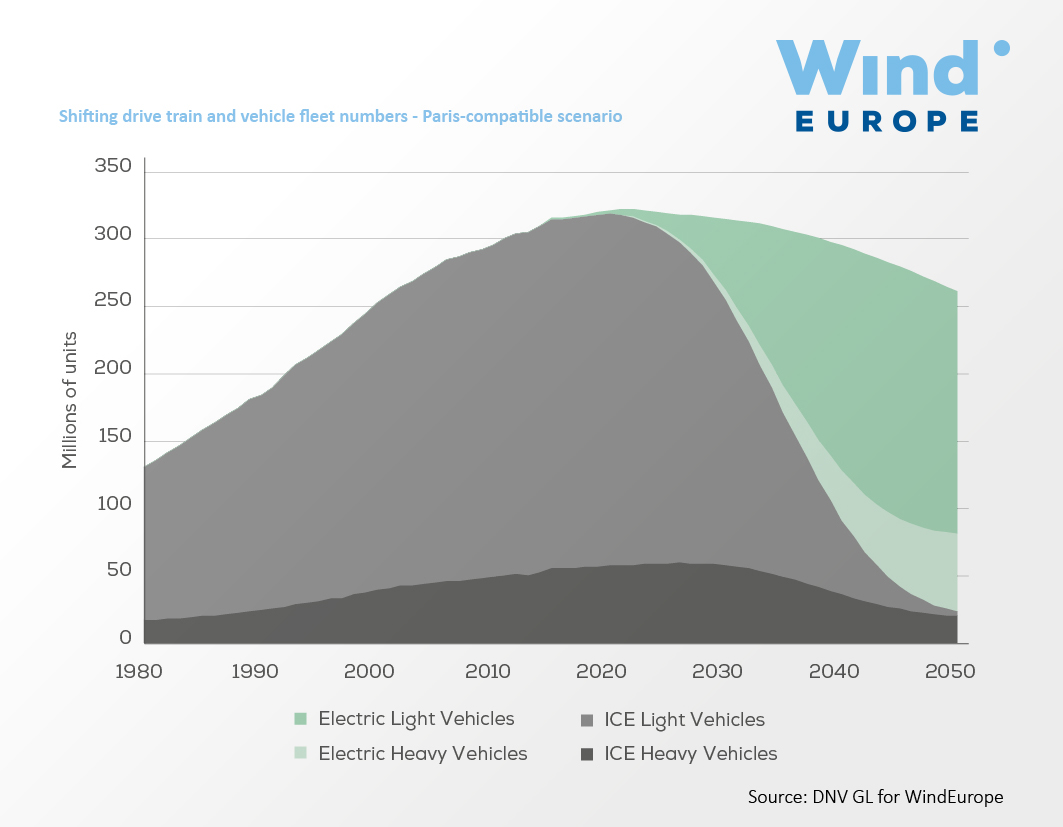
Shifting drive train and vehicle fleet numbers
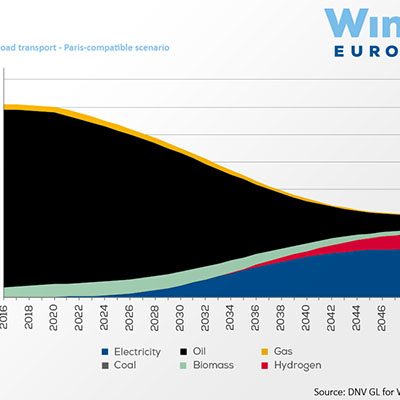
Fuel use in road transport
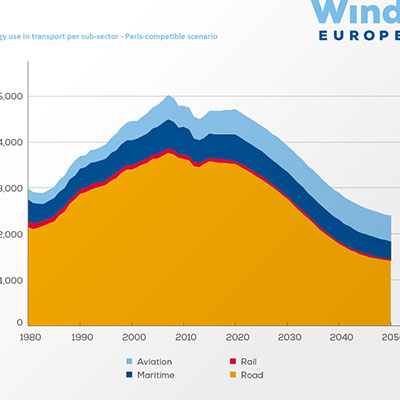
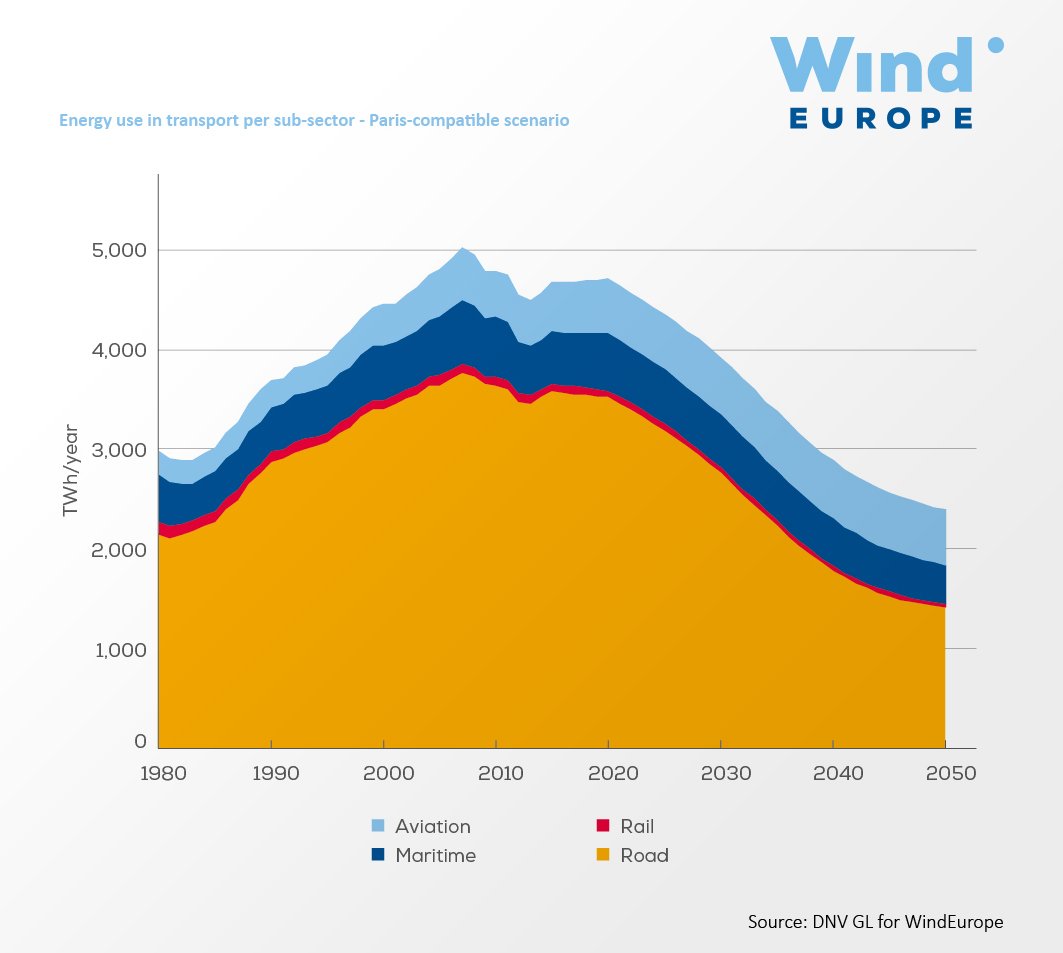
Energy use in transport per sub-sector
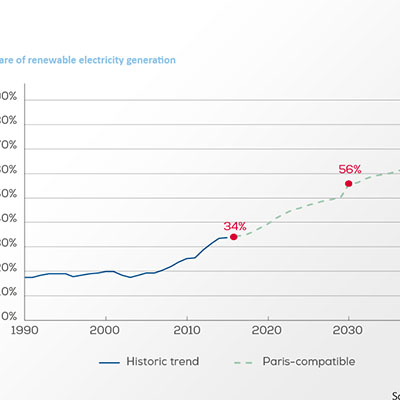
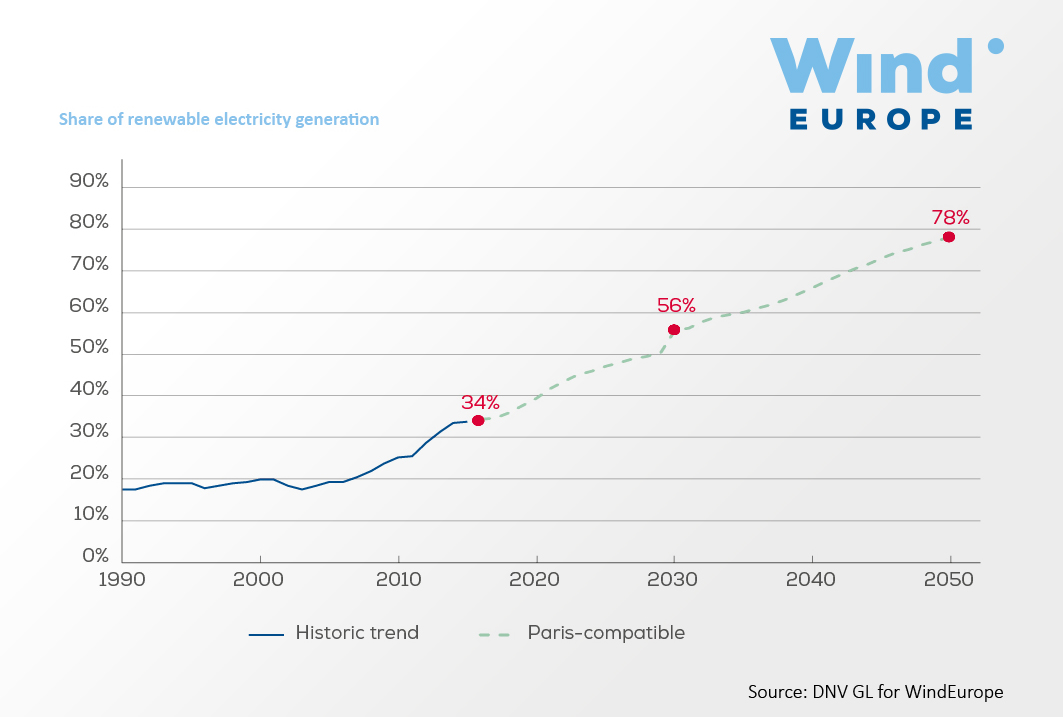
Share of renewable electricity generation
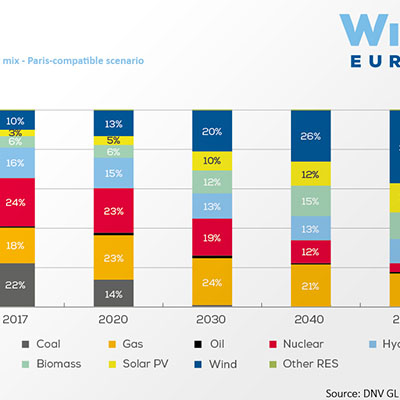
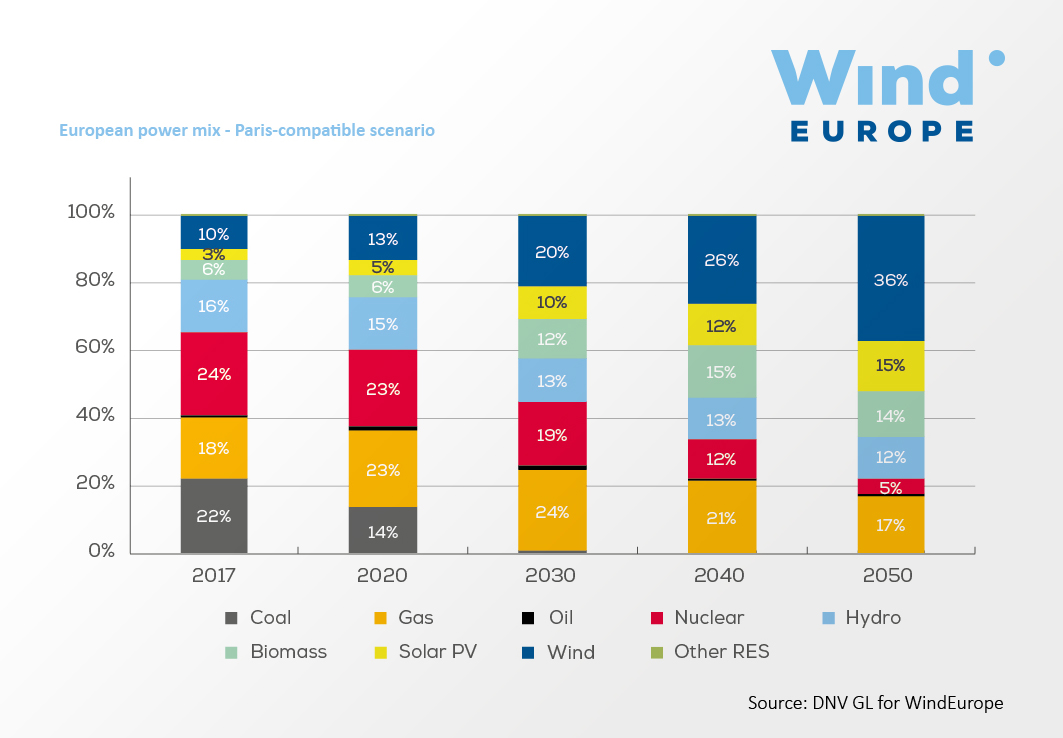
European power mix
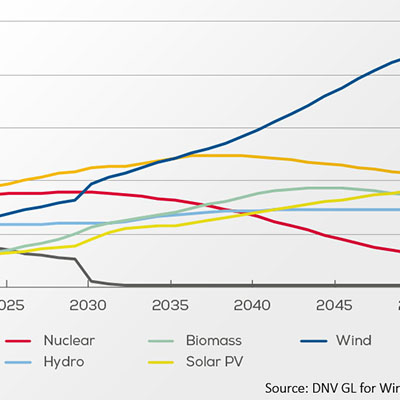
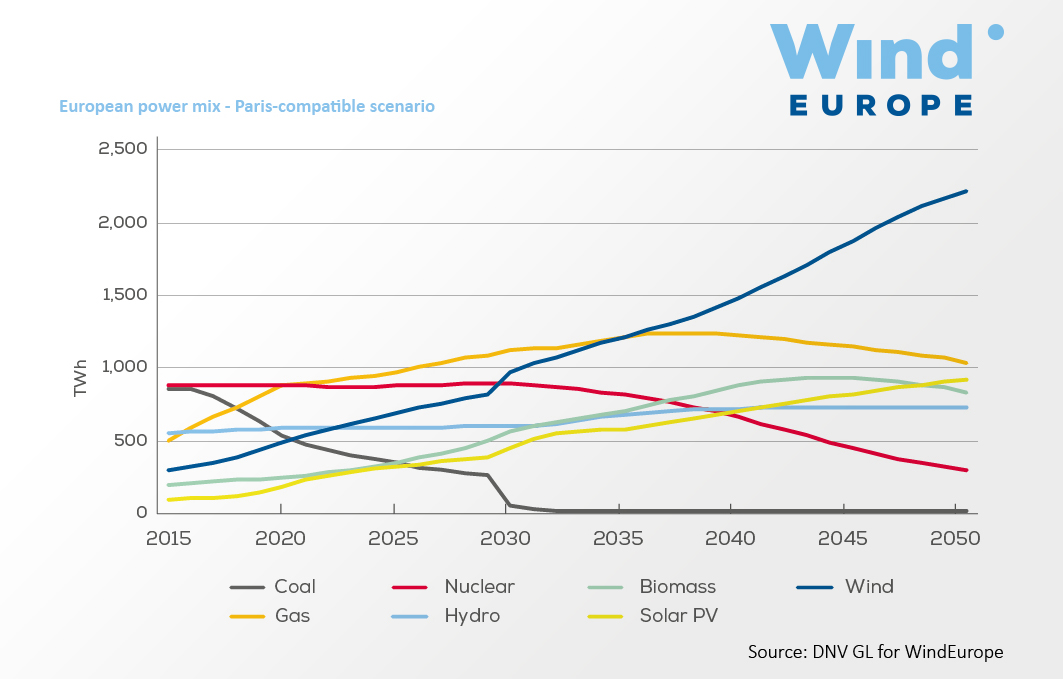
European power mix
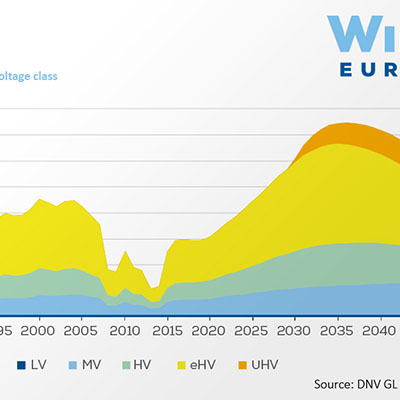
Grid capacity additions by voltage class
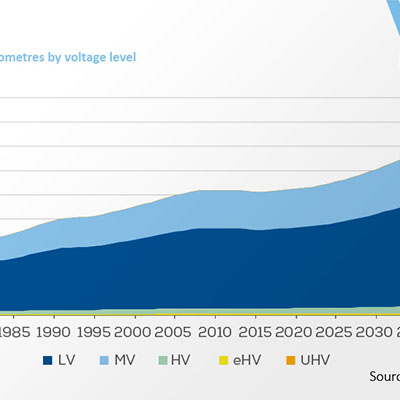
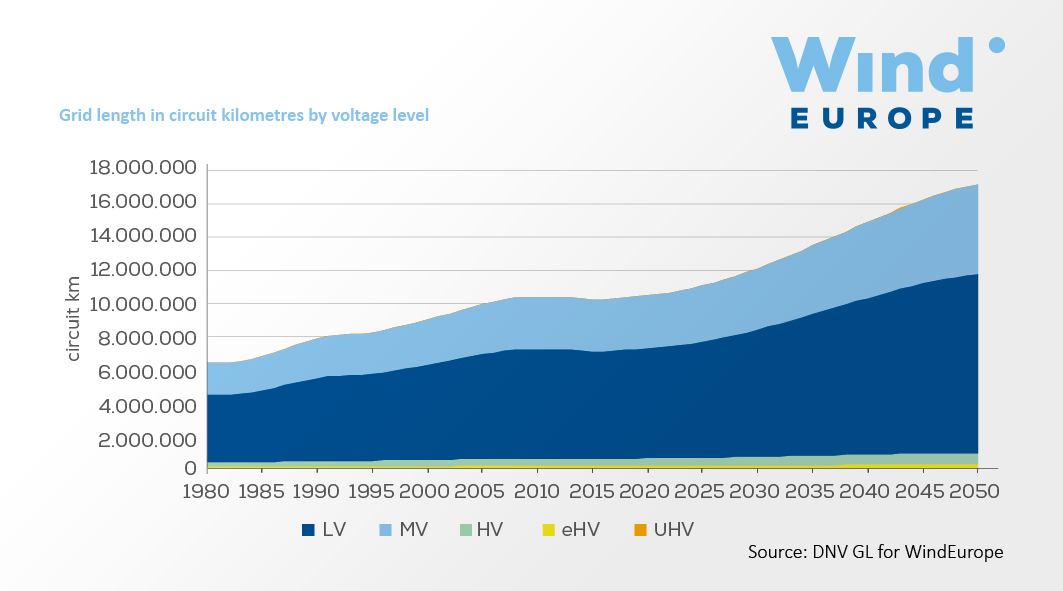
Grid length in circuit kilometres by voltage level
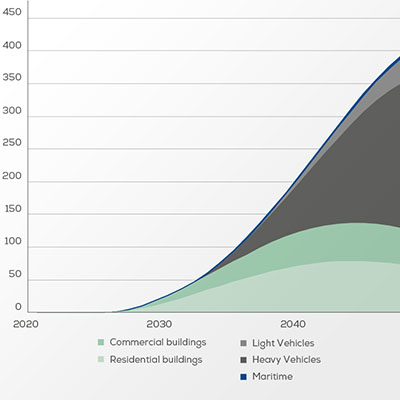
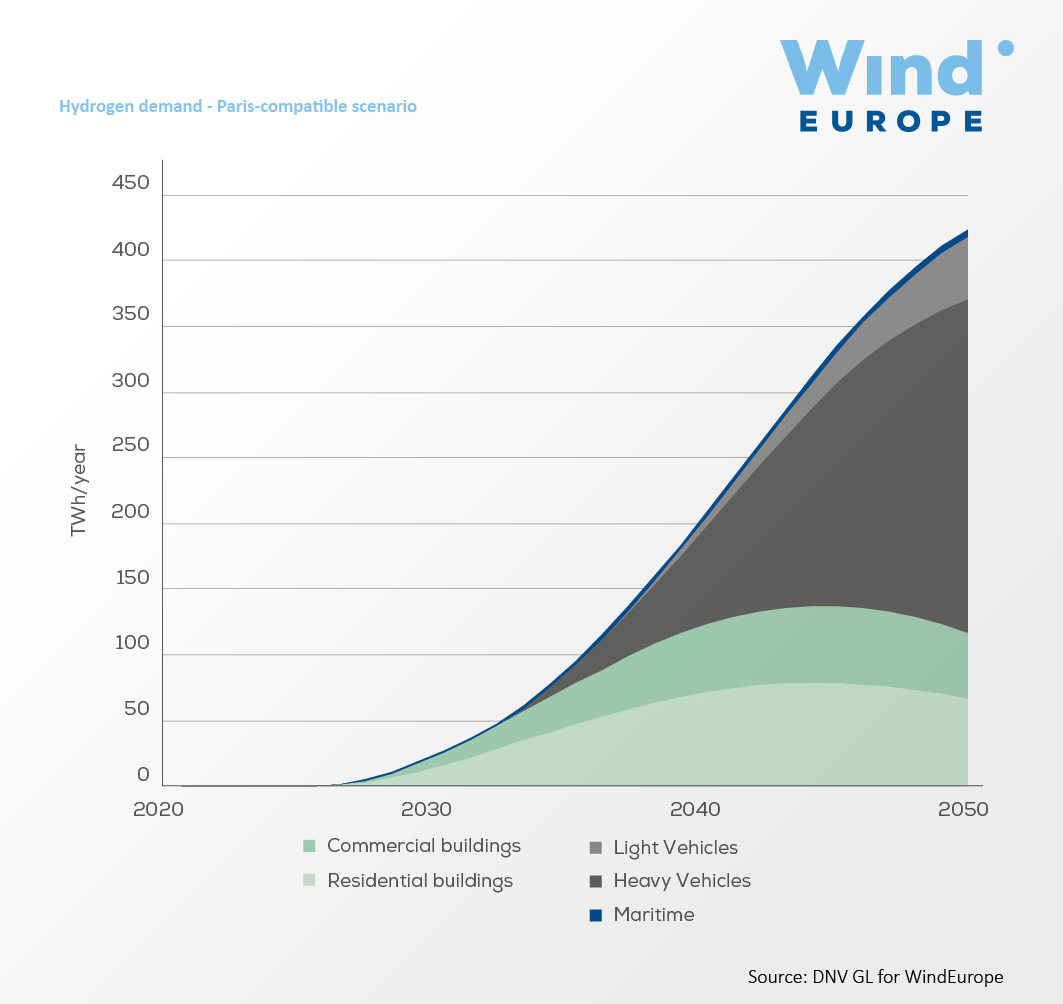
Hydrogen demand
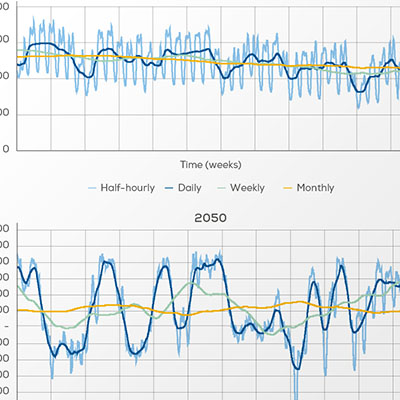
Residual load over 6 weeks in 2017 and 2050 in the Netherlands
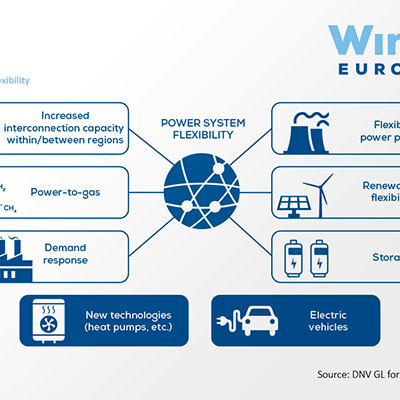
Sources of flexibility
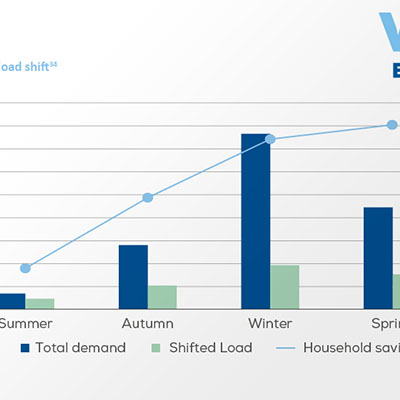
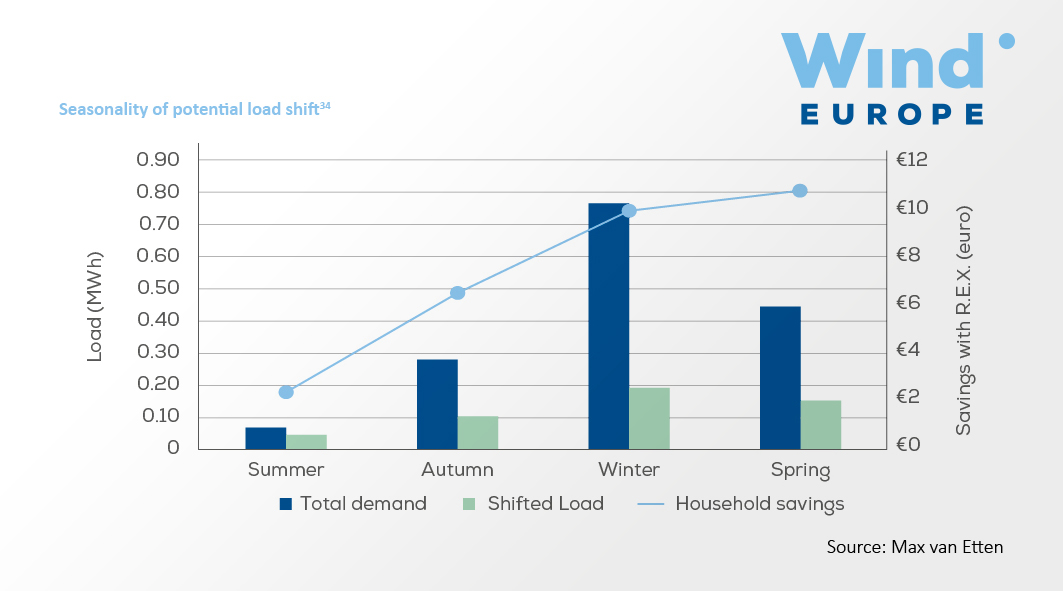
Seasonality of potential load shift
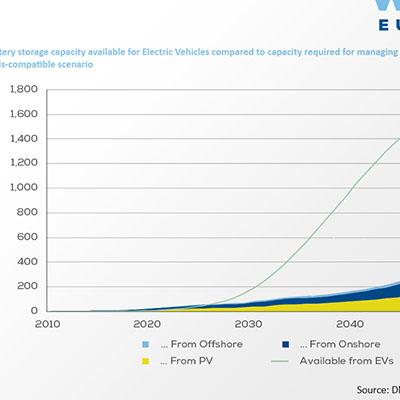
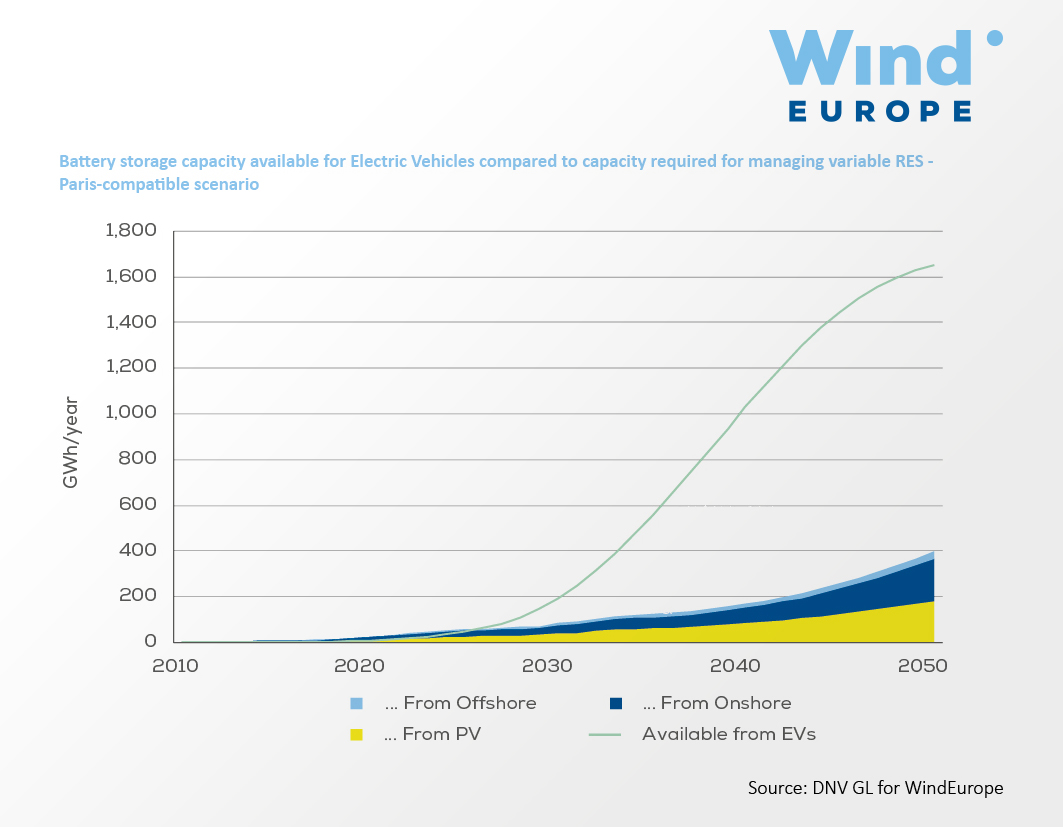
Battery storage capacity available for Electric Vehicles compared to capacity required for managing variable RES


Watch the video
