
13 February 2018
Wind in Power: 2017 European Statistics
Overview
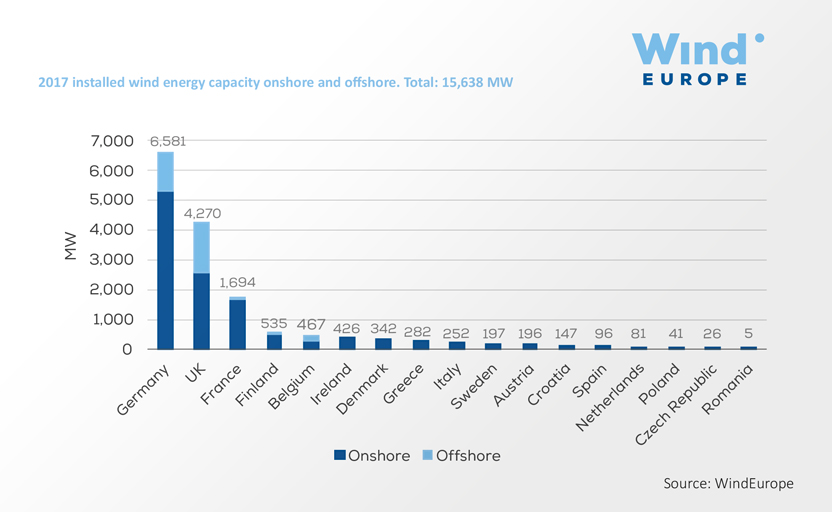
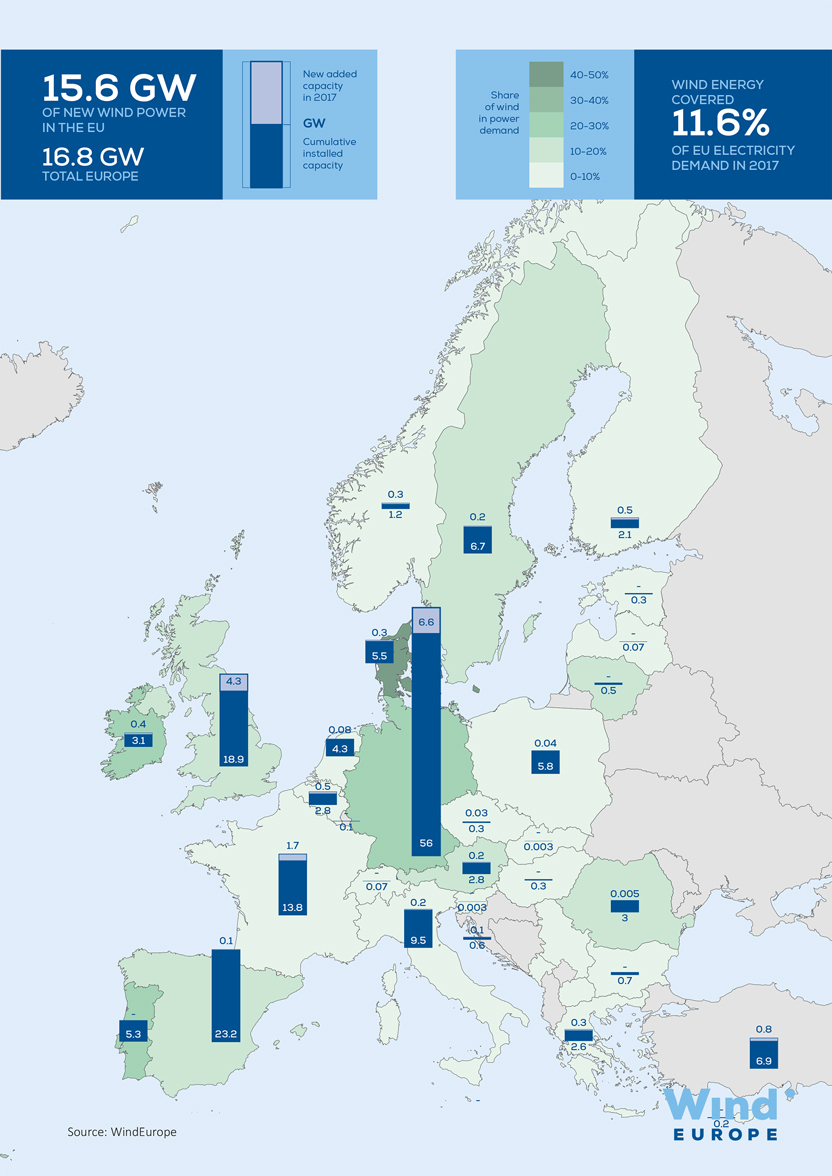
Europe installed 16.8 GW (15.6 GW in the EU) of additional wind power capacity in 2017, marking a record year on annual installations.
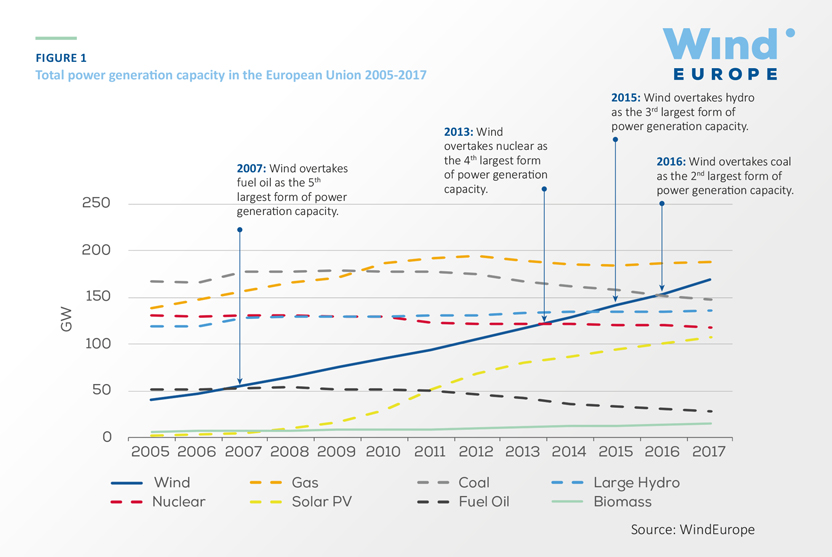
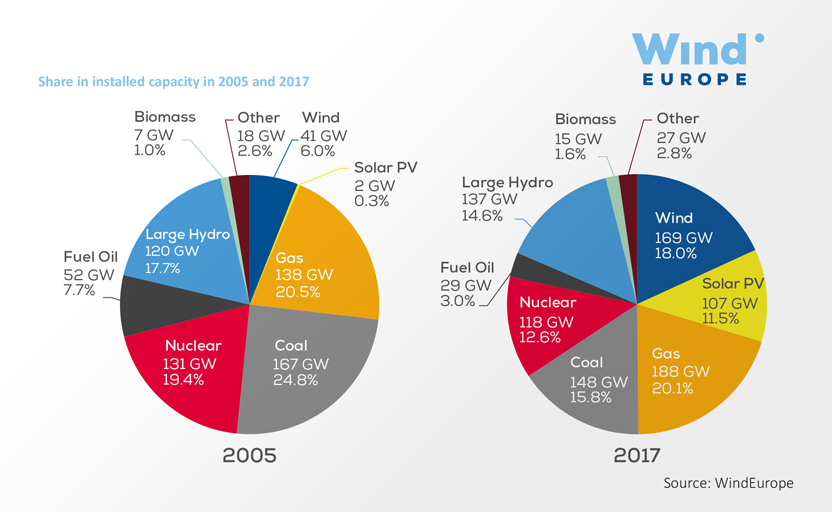
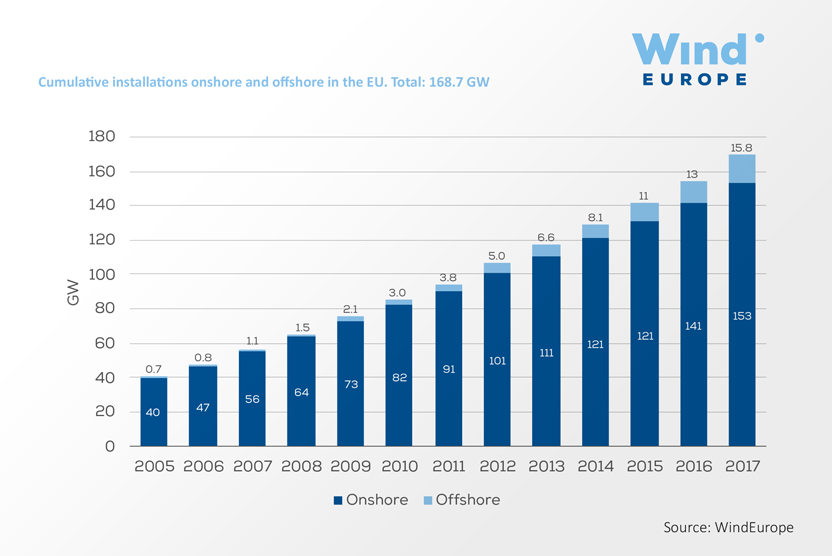
With a total net installed capacity of 169 GW, wind energy remains the second largest form of power generation capacity in Europe, closely approaching gas installations.
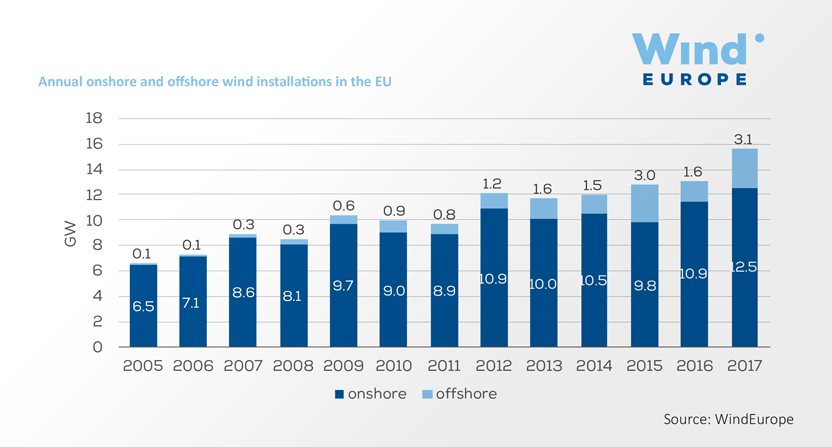
2017 was a record year for both onshore and offshore installations. The EU added 12,484 MW onshore and 3,154 MW offshore.
Findings


Explore the key figures
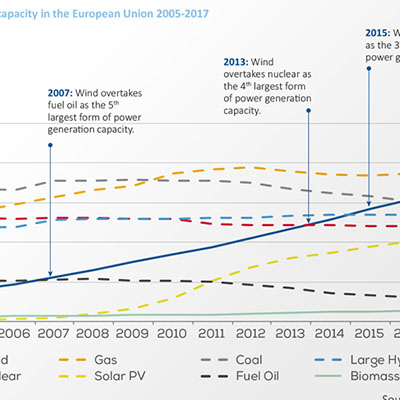
Total power generation capacity in the European Univion 2005-2017
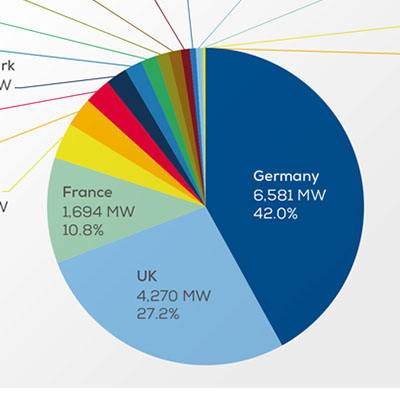
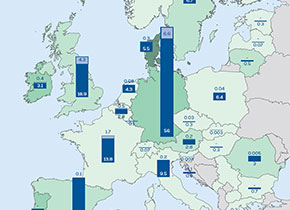
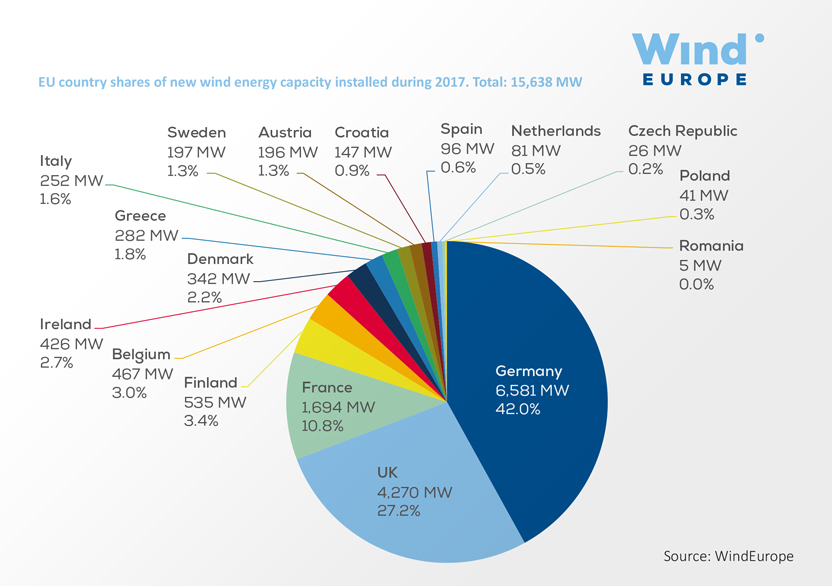
EU country shares of new wind energy capacity installed during 2017.
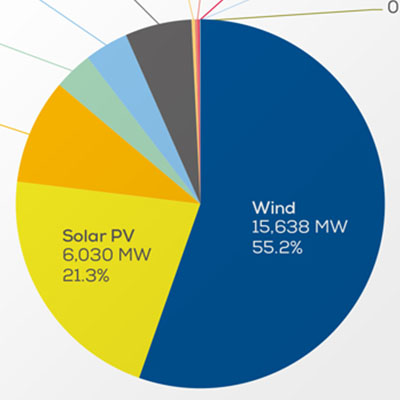
Share of new installed capacity
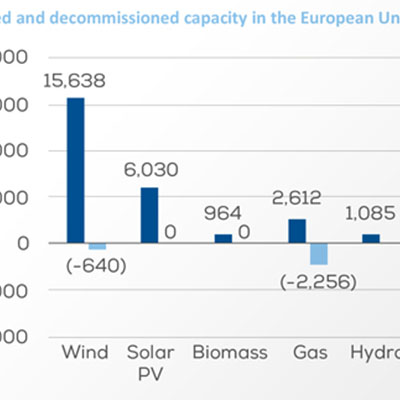
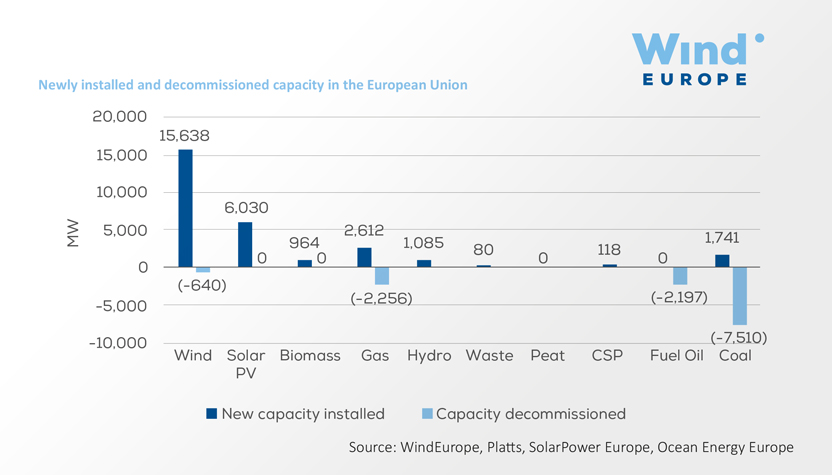
Newly installed and decommissioned capacity in the European Union
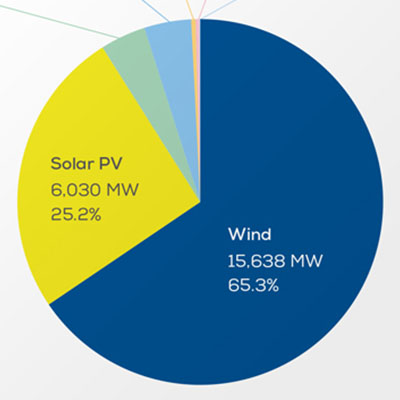
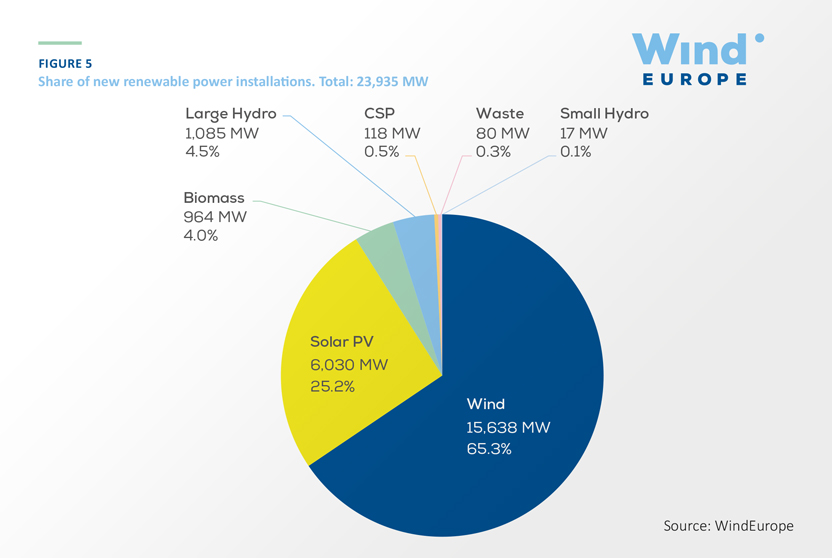
Share of new renewable power installations.
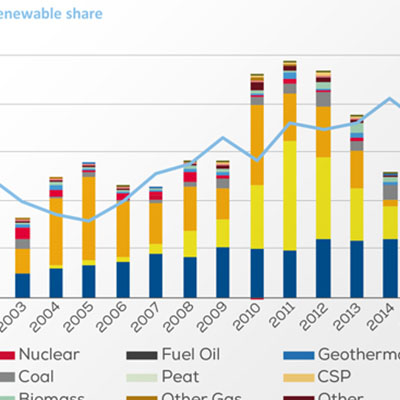
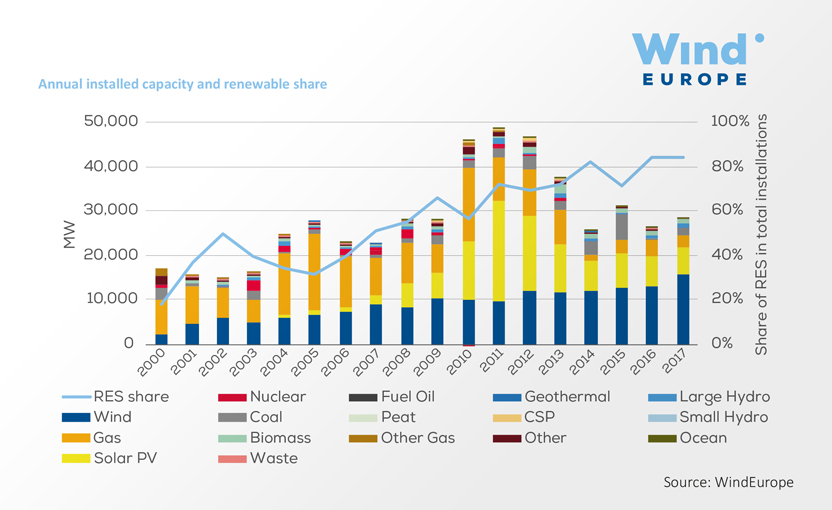
Annual installed capacity and renewable share
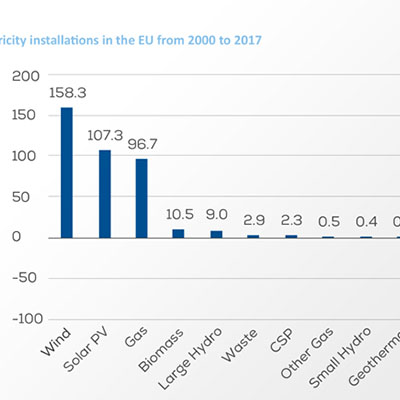
Net electricity installations in the EU from 2000 to 2017
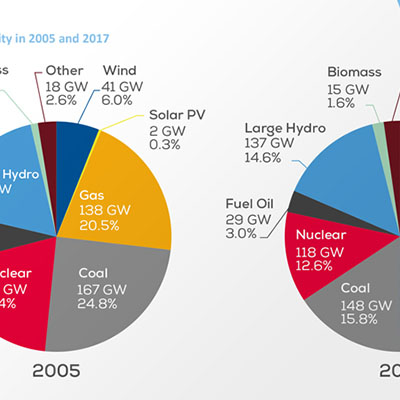
Share in installed capacity in 2005 and 2017
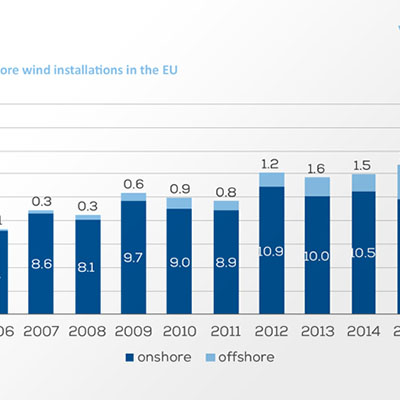
Annual onshore and offshore wind installations in the EU
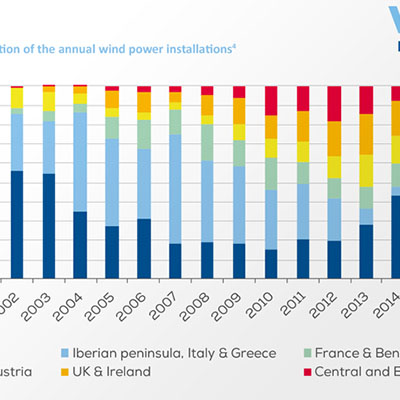
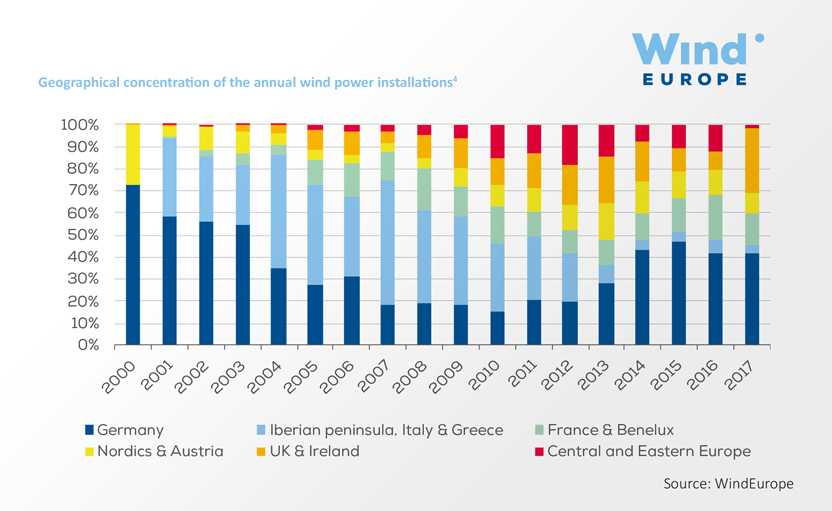
Geographical concentration of the annual wind power installations
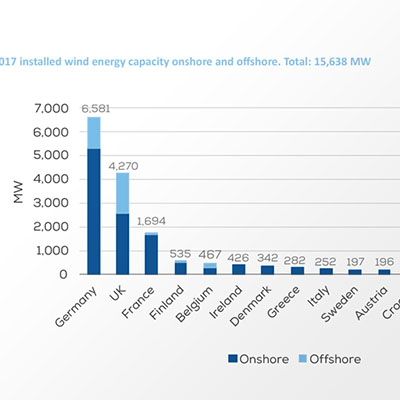
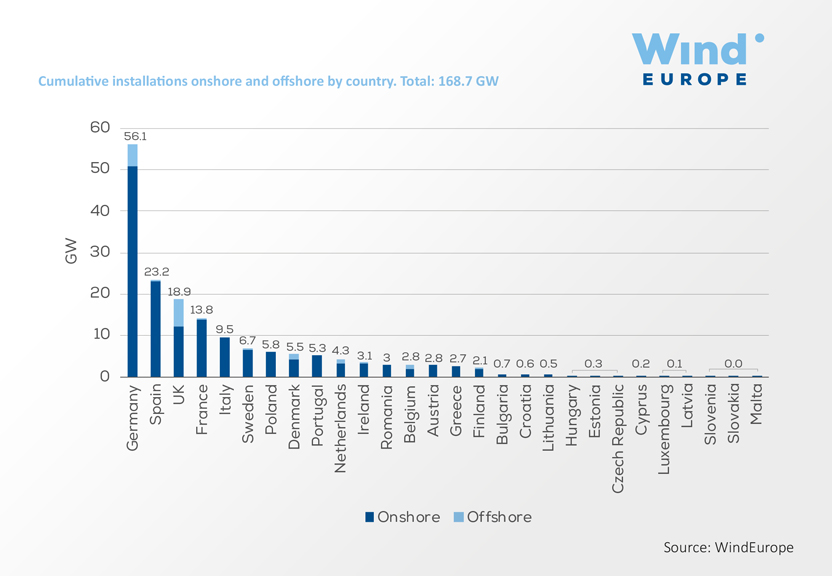
Installed wind energy capacity onshore and offshore
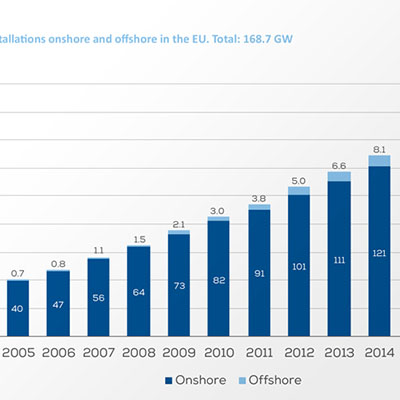
Cumulative installations onshore and offshore in the EU
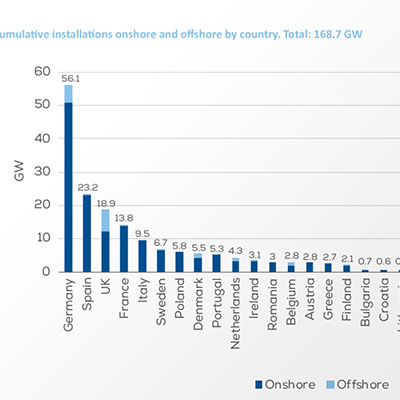
Cumulative installations onshore and offshore by country.
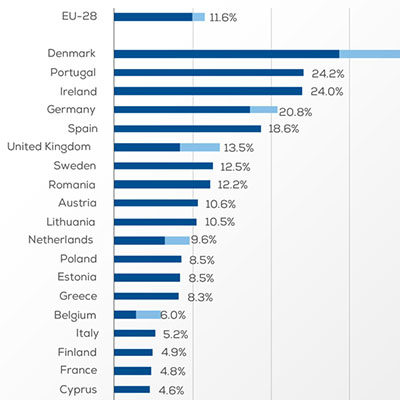
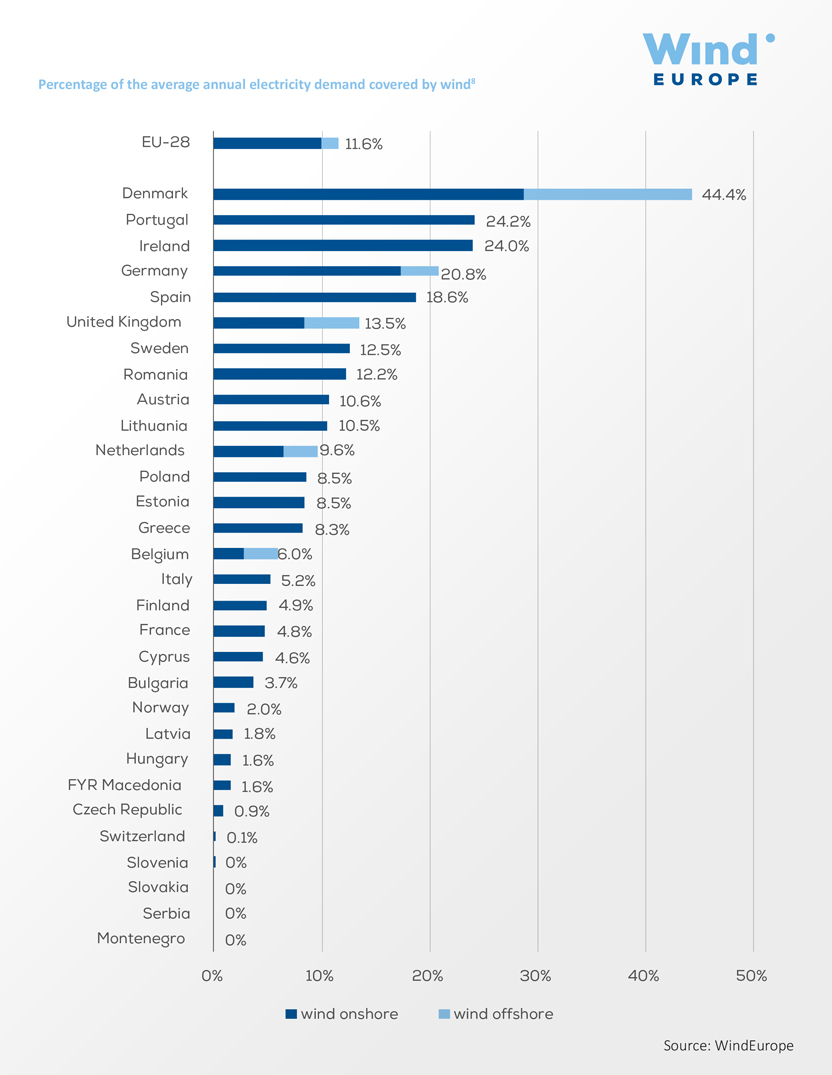
Percentage of the average annual electricity demand covered by wind
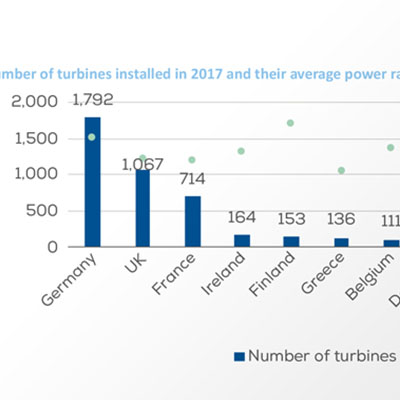
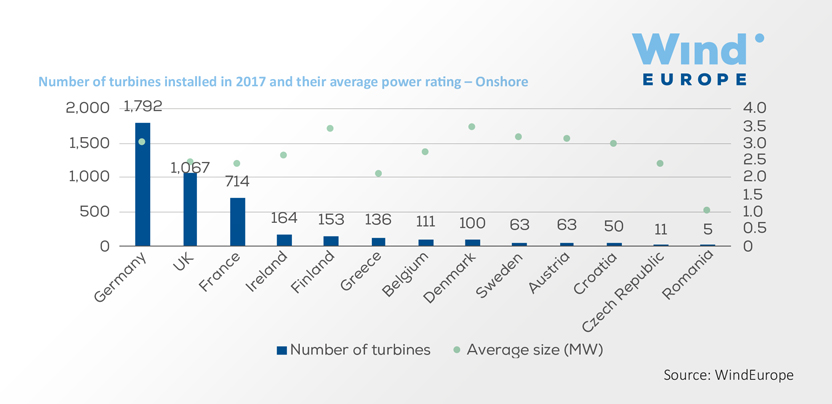
Number of turbines installed in 2017 and their average power rating – Onshore
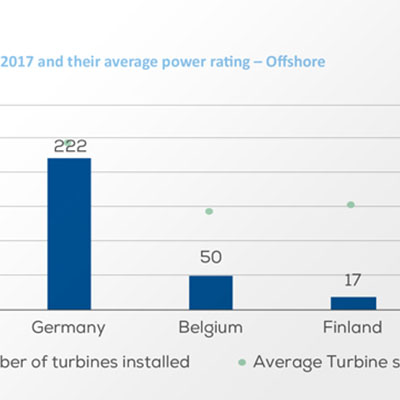
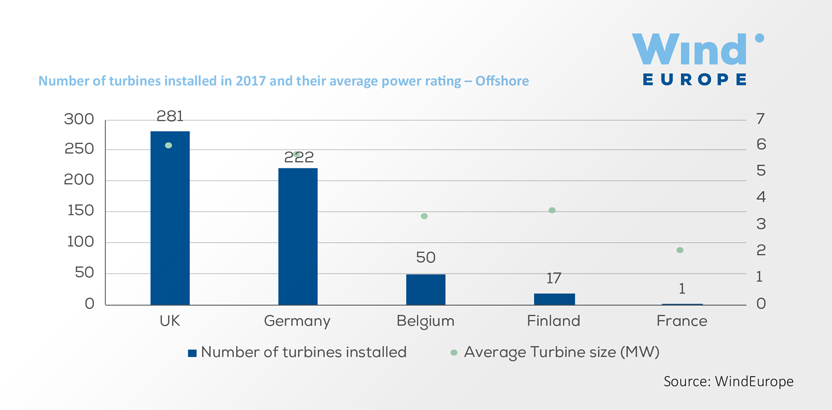
Number of turbines installed in 2017 and their average power rating – Offshore
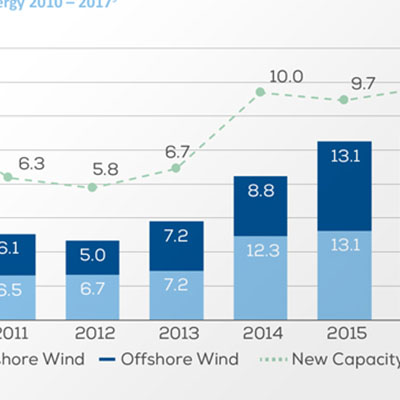
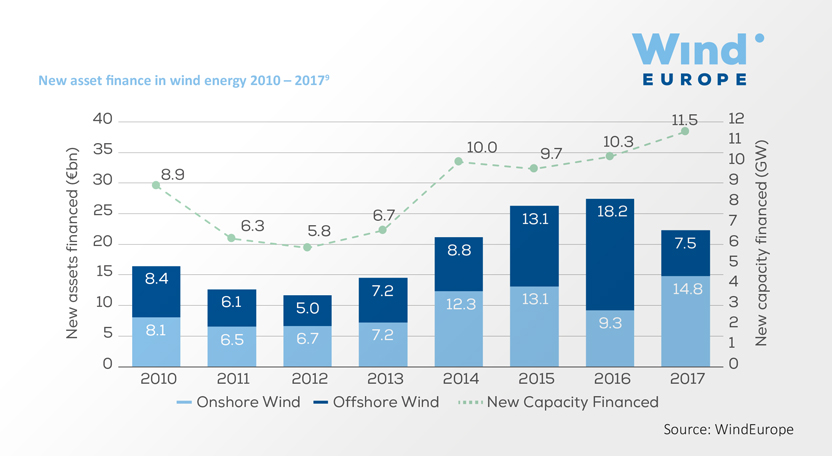
New asset finance in wind energy 2010 – 2017
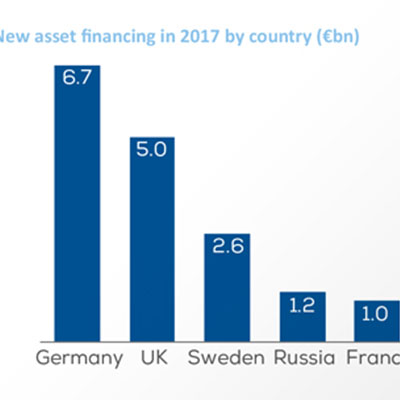
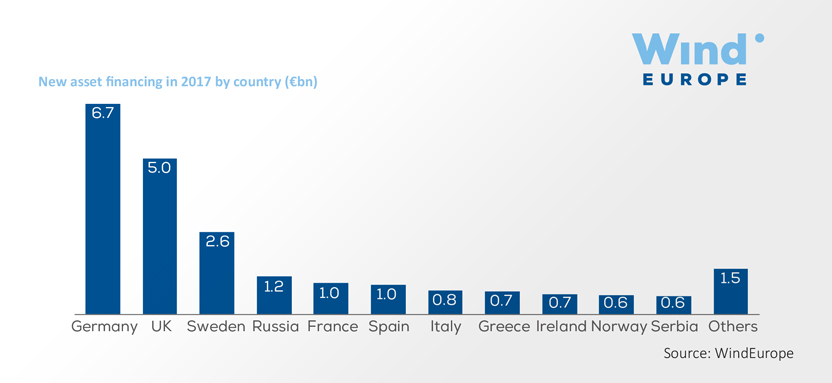
New asset financing in 2017 by country (€bn)
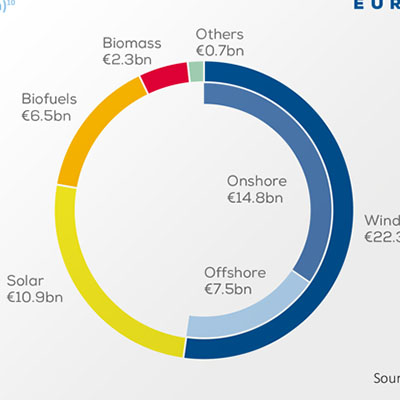
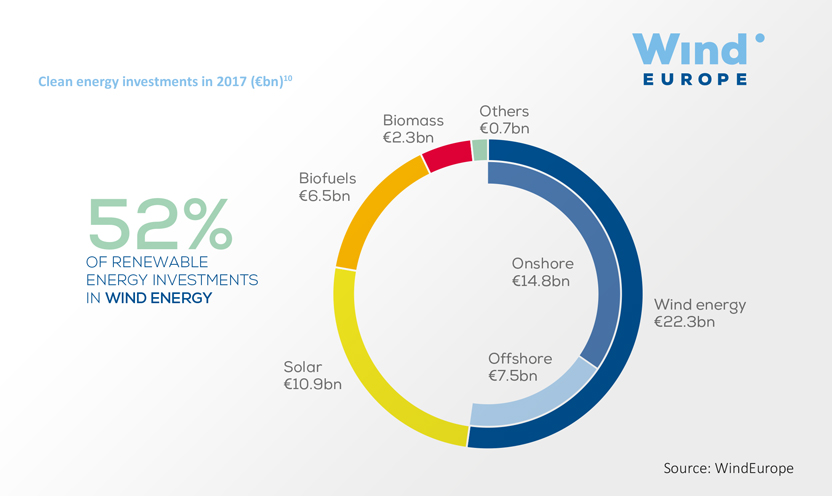
Clean energy investments in 2017 (€bn)
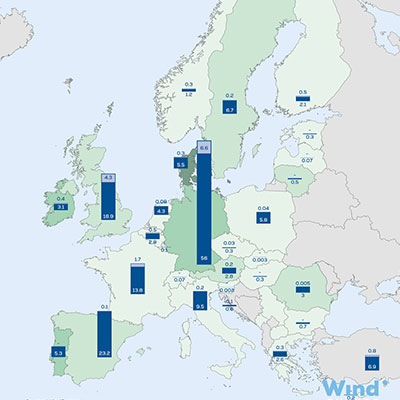
Map


Check the presentation
Are you a WindEurope Member?
The full presentation is available as a video and a PDF in the members’ area for WindEurope members
Not a member yet?
Contact our colleague Joana Griffin and learn about WindEurope membership services and benefits.
