Published on 21 February 2019
Overview
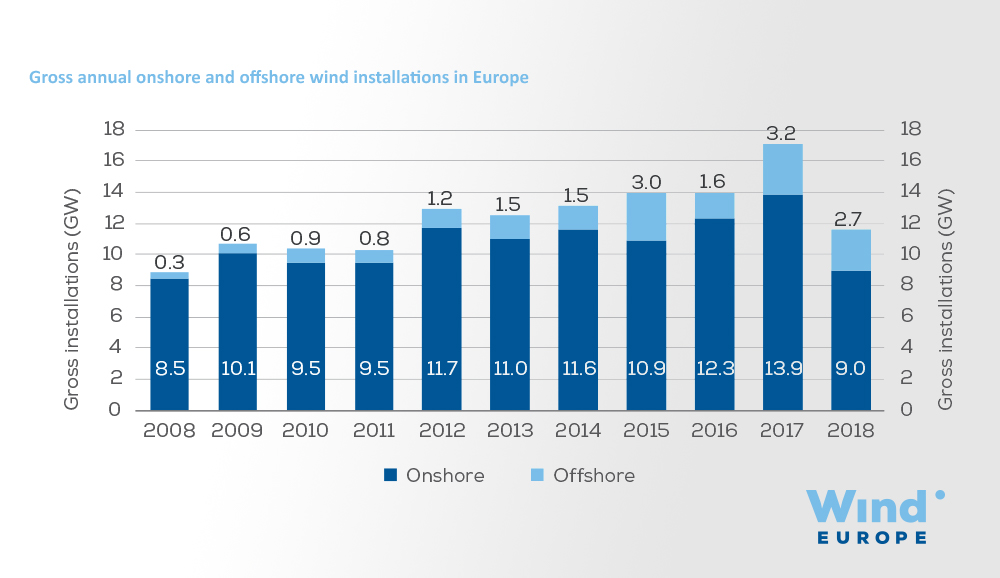
Europe installed 11.7 GW (10.1 GW in the EU) of gross power capacity in 2018, This was 33% down on 2017.
With a total net installed capacity of 189 GW, wind energy remains the second largest form of power generation capacity in Europe, set to overtake gas installations in 2019.
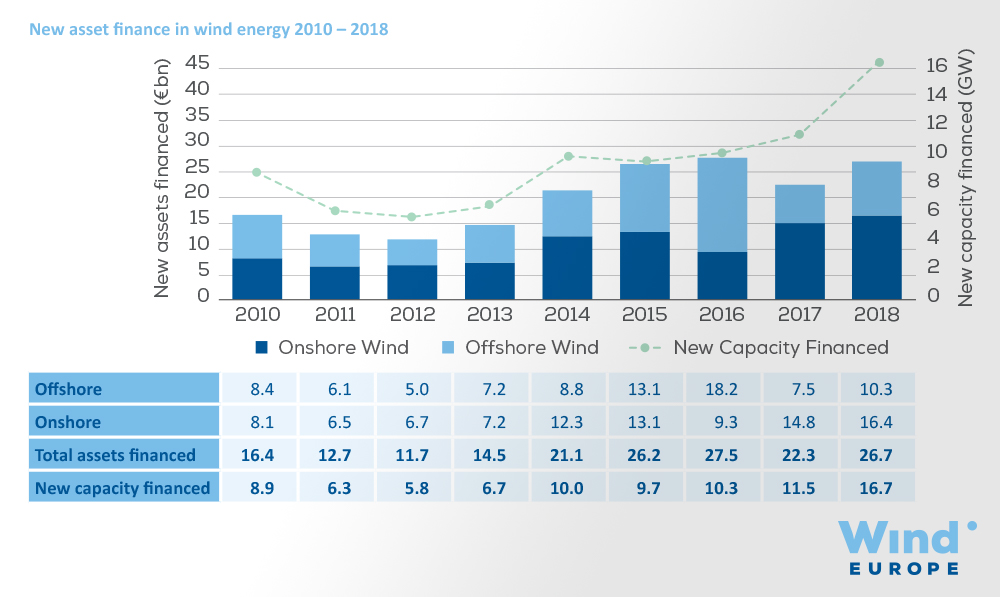
2018 was a record year for new wind capacity financed. 16.7 GW of future projects reached Final Investment Decision.
With a total net installed capacity of 189 GW, wind energy remains the second largest form of power generation capacity in Europe, set to overtake gas installations in 2019.
2018 was a record year for new wind capacity financed. 16.7 GW of future projects reached Final Investment Decision.
Findings
1
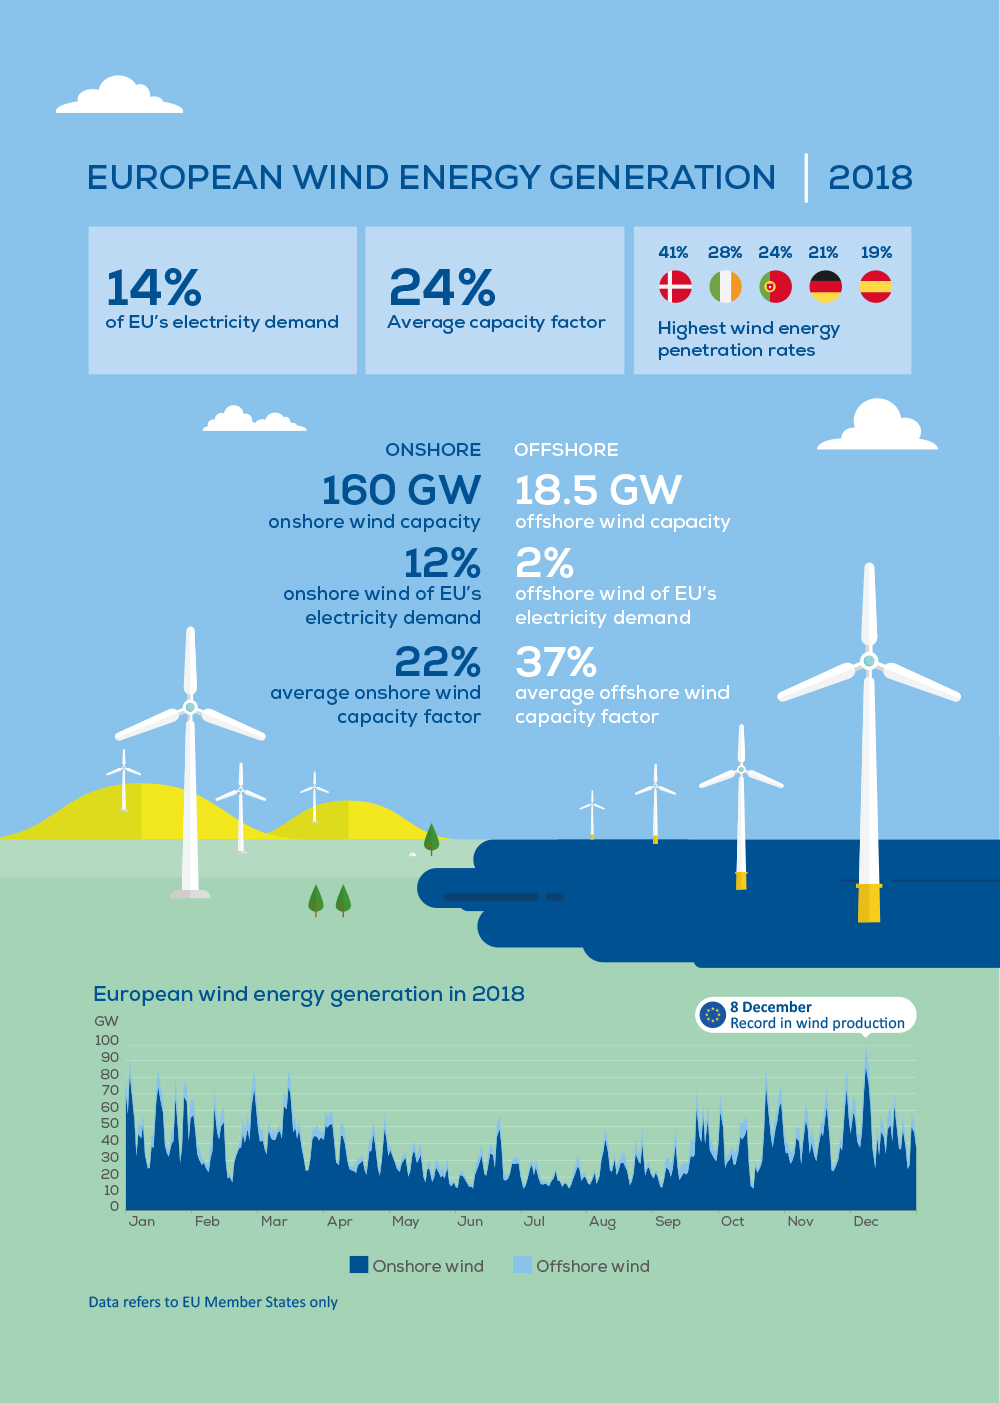
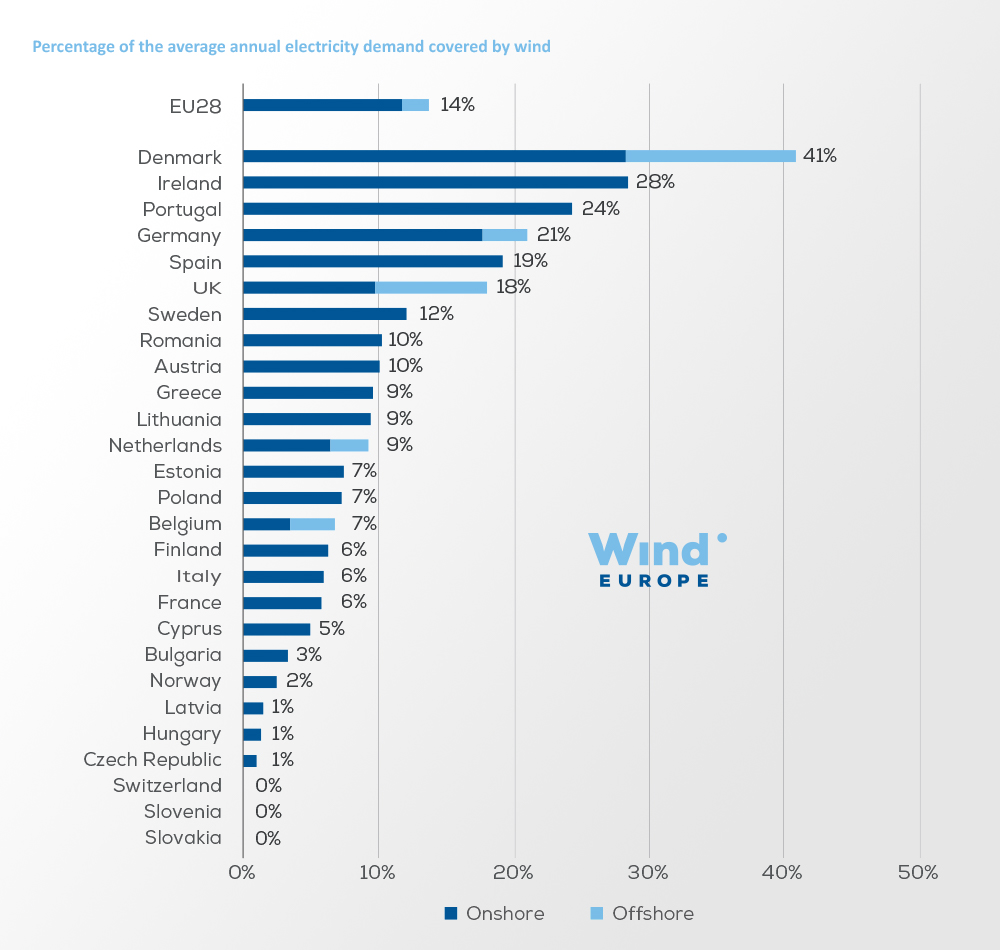
Wind energy is now 14% of the EU's electricity (up from 12% in 2017).
2
Wind power capacity rose by 11.3 GW in 2018: 8.6 GW onshore and 2.65 GW offshore. This was down 33% on 2017.
3
Denmark had the highest share of wind in its electricity last year (41%), followed by Ireland (28%) and Portugal (24%).
4
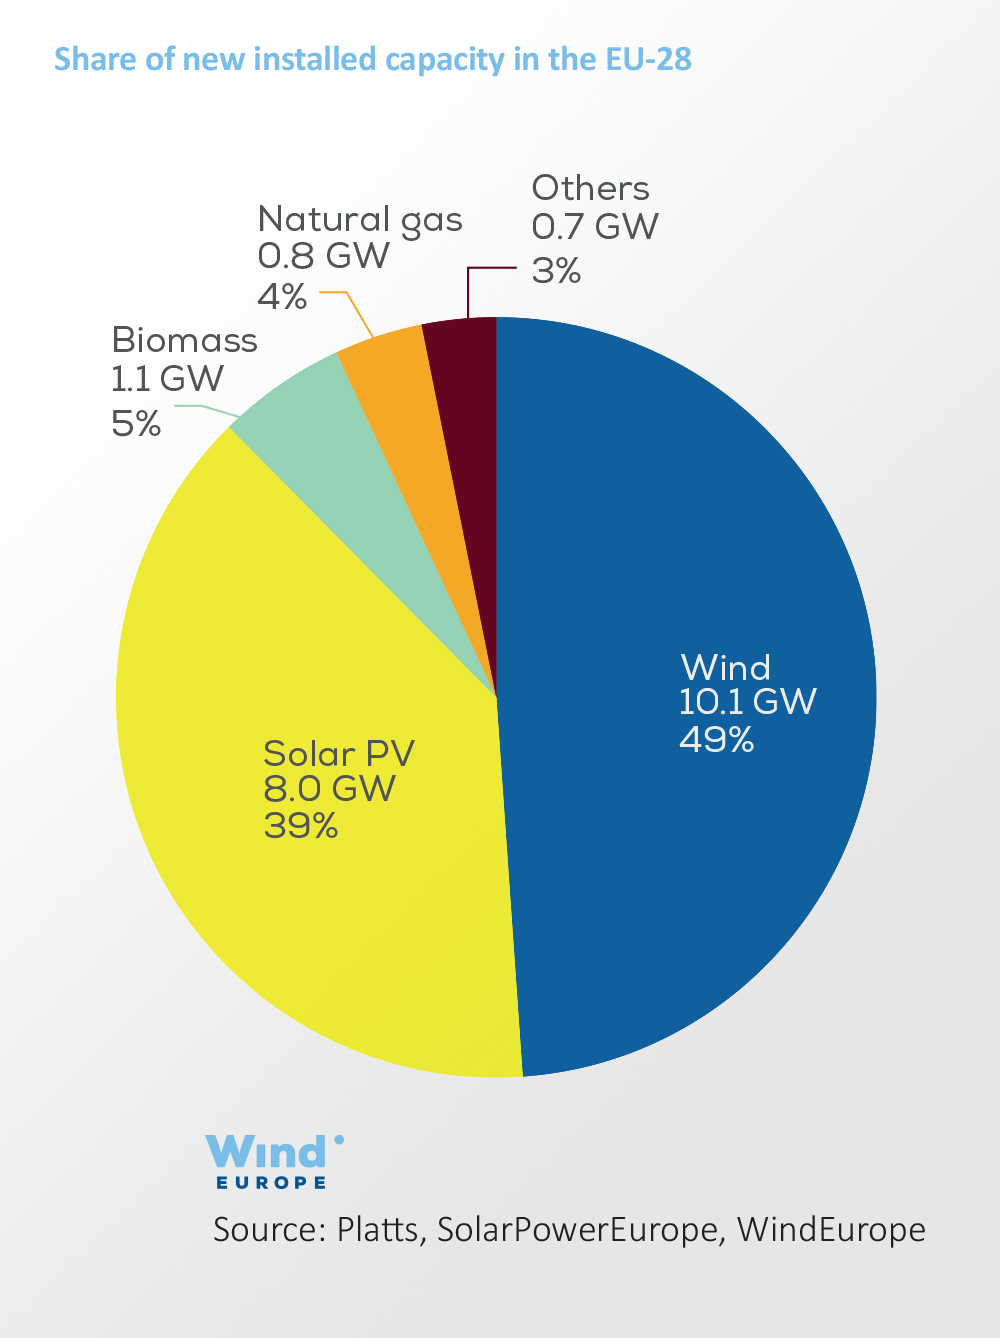
The EU installed more wind energy capacity than any other form of electricity generation in 2018.
5
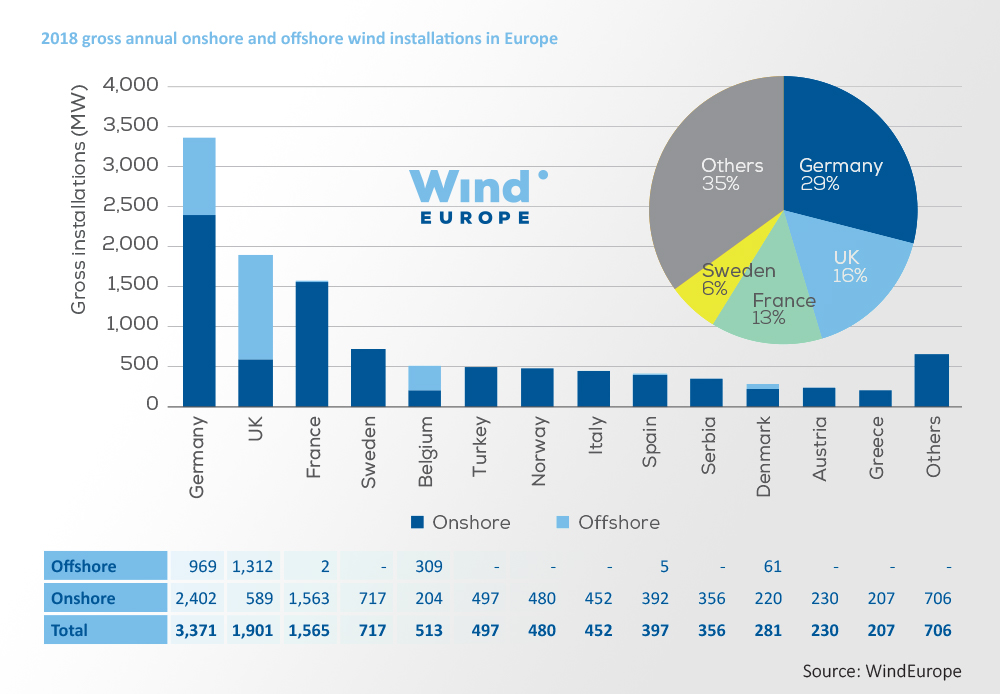
Germany installed the most wind in 2018 (29% of new installations), followed by the UK, France, Sweden and Belgium.
6
2018 was a record year for new wind capacity financed. 16.7 GW of future projects reached Final Investment Decision.
Presentation
Please log in to see this section.
Please log in to see this section.
Webinar
Please log in to see this section.
Please log in to see this section.
Interactive Data
Please log in to see this section.
Please log in to see this section.


